Patent Litigation
District Court
1,138 patent cases were filed in the second quarter of 2017, a 18% increase over number of cases filed in the first quarter of 2017. A similar increase from the first to second quarter has happened in each of the previous 4 years.
Although the number of cases filed in the first quarter of 2017 was one of the lowest in the last 5 years, the first half of 2017 only trails 2016’s first half by 7%.
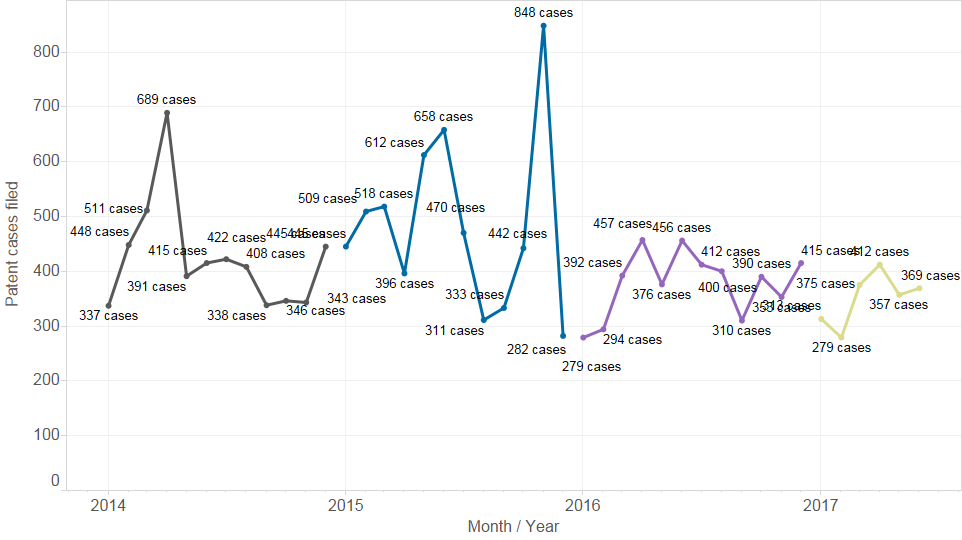
Figure 2 below shows that 2017 continues the pattern of relatively consistent monthly totals that has persisted since the dramatic spike in 2015 (caused by the end of Form 18).
Fig. 1: Patent cases filed, 2011 – 2017 Q2, by quarter
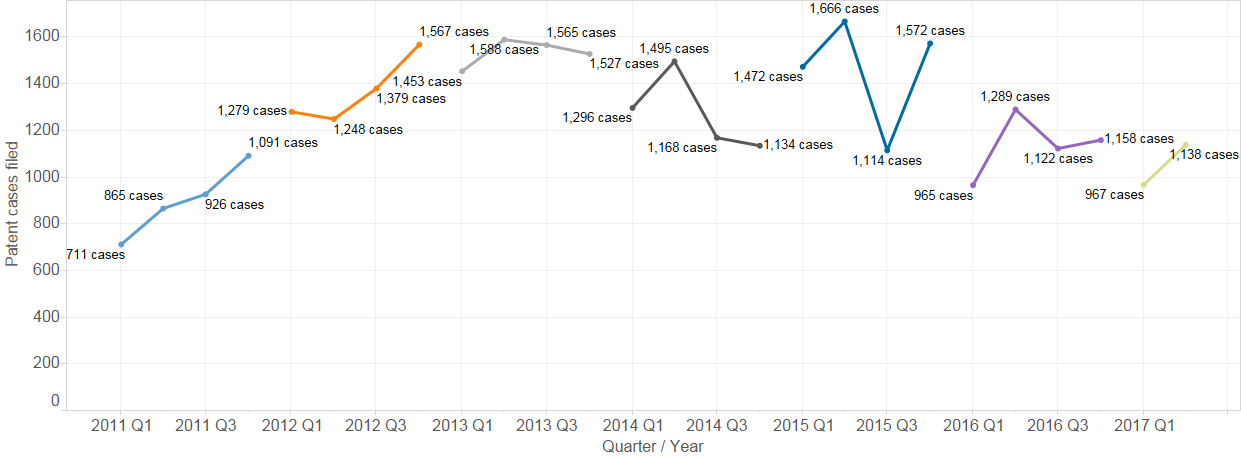
Fig. 2: Patent cases filed, 2014 – 2017 Q2, by month
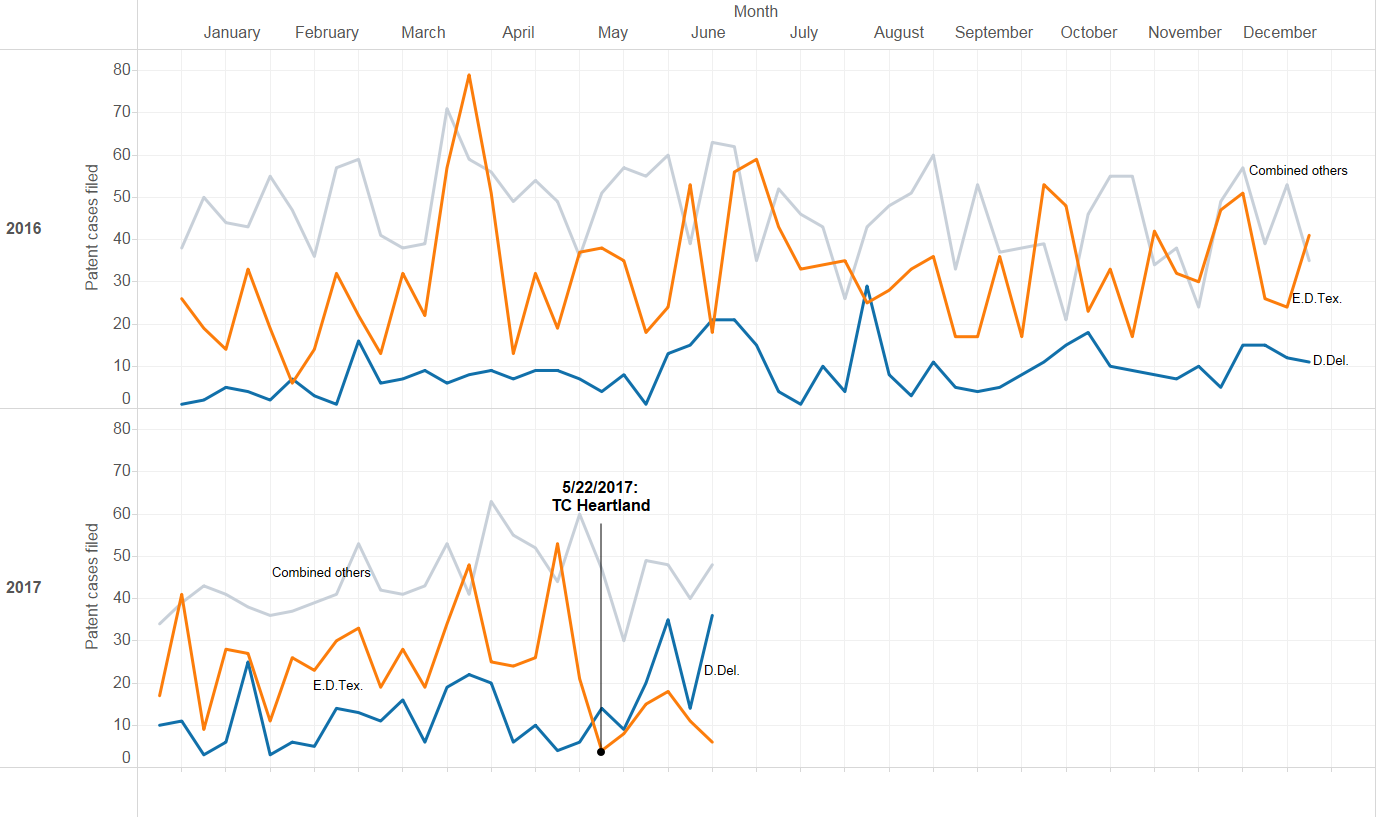
In recent years, a large percentage of the patent cases have been filed in the Eastern District of Texas – typically between 30 and 40 percent.
However, the share of cases filed in the Eastern District of Texas has significantly declined since the Supreme Court’s opinion in T.C. Heartland (May 22, 2017), as shown in the week-by-week analysis of Figure 4 below. The District of Delaware appears to be the primary beneficiary, showing an increase since the decision.
Fig. 3: Top districts by patent cases filed 2014-2017 Q2

Fig. 4: Eastern District of Texas and District of Delaware, 2016-2017 Q2 by quarter
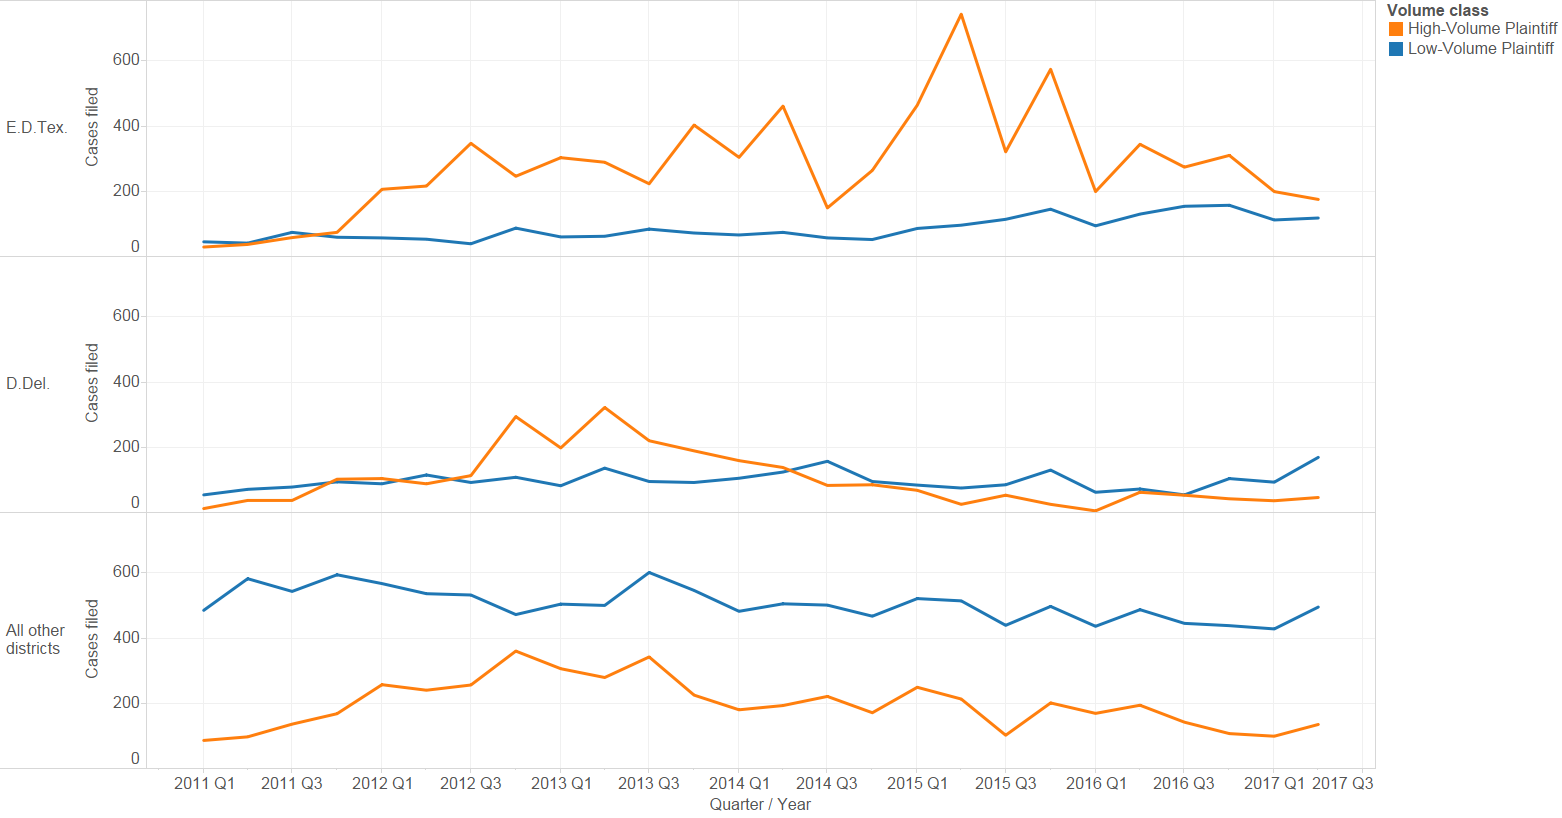
To gain more insight into patent litigation, cases can be broken down according to whether the plaintiff* has filed at least 10 other cases within a 365 day span (high volume) or not (low volume). This simple behavioral measure reveals that patent litigation in the Eastern District of Texas and in the District of Delaware differs starkly from litigation in other districts: a far higher percentage of E.D.Tex. and D.Del. litigation is from high volume plaintiffs.
Moreover, in those two districts, high volume plaintiffs drive most of the volatility in case filings, both in time (i.e. spikes and dips within Eastern Texas) and between districts (i.e. Delaware’s decline corresponds to the rise in Eastern Texas). In contrast, litigation by low volume plaintiffs is relatively consistent across time and districts.
Although high volume cases in the most recent quarter may be undercounted due to the timing of filing campaigns, high volume plaintiff activity has been declining since 2015.
* or more precisely, whether a plaintiff (or declaratory judgement defendant) has filed (or been subject to a declaratory judgment case) in at least 10 other cases within 365 days. Although the values of 10 and 365 are somewhat arbitrary, the conclusions hold for a range of these values.
Fig. 5: Plaintiff volume class, 2011-2017 Q2
The Patent Trial and Appeal Board
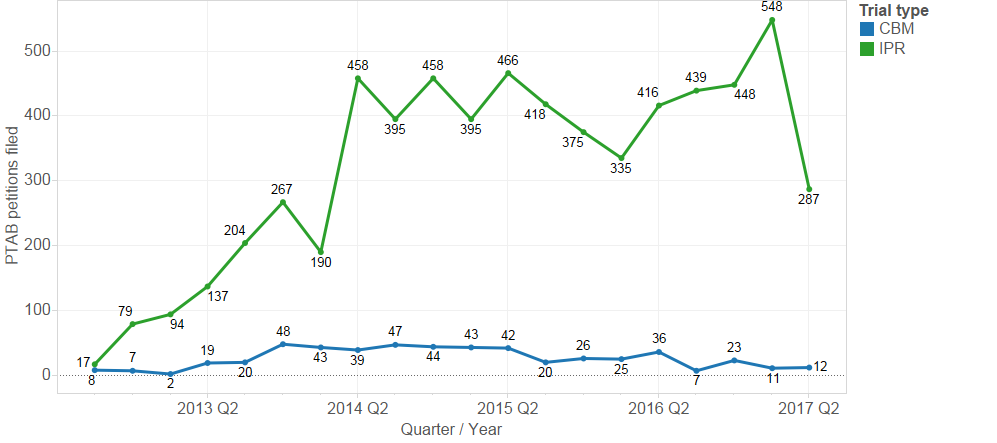
While the first quarter of 2017 saw a record high number Inter Partes Review (IPR) petitions filed at PTAB (548 petitions), the second quarter is significantly lower than any other quarter since the first quarter of 2014.
This crest/trough may be related to the Supreme Court’s granting of certiorari in Oil States Energy Servs., v. Greene’s Energy Grp. in June 2017 – a case in which petitioners argue that IPR is unconstitutional, as a non-Article III forum extinguishing a property right without a trial by jury.
There were also 12 Covered Business Method (CBM) reviews, a number consistent with previous figures.
Fig. 6: CBM and IPR petitions, 2012 – 2017 Q2, by quarter
Trademark Litigation
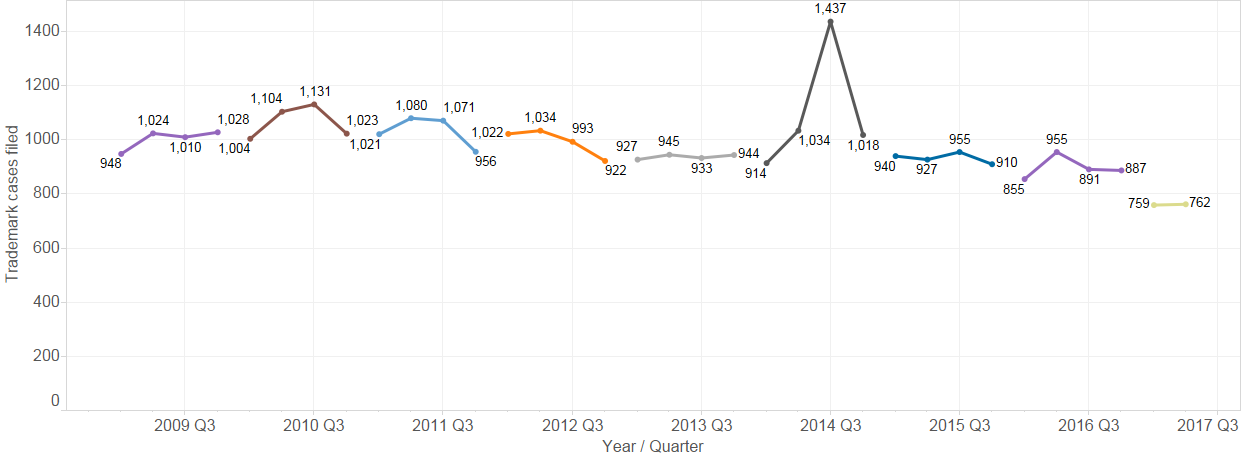
Trademark litigation filing trends have been more predictable than patent trends (or copyright). The filing of new trademark cases has declined at a slight rate over the last few years. The second quarter of 2017 (762 cases) represents a continuation of this trend.
For the curious, the spike in trademark case filings seen below in the third quarter of 2014 was driven by a flood of cases filed in the District of Minnesota against the National Football League, generally by former players over usage of their likeness. These cases account for about 461 of the 1,425 cases filed in Q3 2014. Without these cases, Q3 2014 appears otherwise consistent with the quarters surrounding it.
Fig. 7: Trademark cases filed, 2009 – 2017 Q2, by quarter
Copyright Litigation
Lex Machina divides copyright litigation in the U.S. district courts into two subtypes: file sharing cases (those having John Doe or anonymous defendants and accusations based on file sharing technology such as BitTorrent), and all of the other, more traditional cases. As explained in Lex Machina’s Copyright Litigation Report, these cases follow very different dynamics.
From its apogee in Q1 of 2015, the number of file sharing cases filed each quarter declined steadily until Q2 of 2016. Since then the number has oscillated around 300 cases. However, In the second quarter of 2017, only 151 file sharing cases were filed, representing a low not seen since 2011.
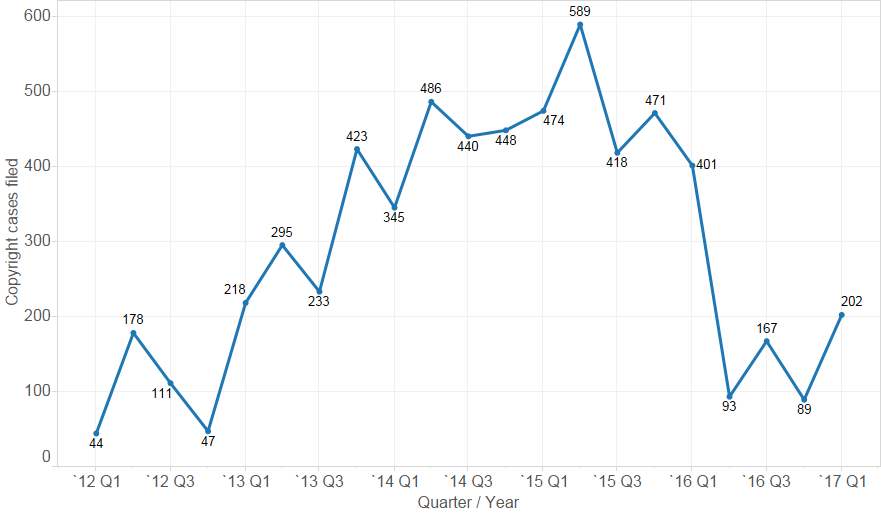
File sharing cases have been largely driven by Malibu Media (as shown in Figure 9 below), but Malibu Media did not file a single case in Q2 2017.
Fig. 8: Copyright cases filed, 2011 – 2017 Q2, by quarter
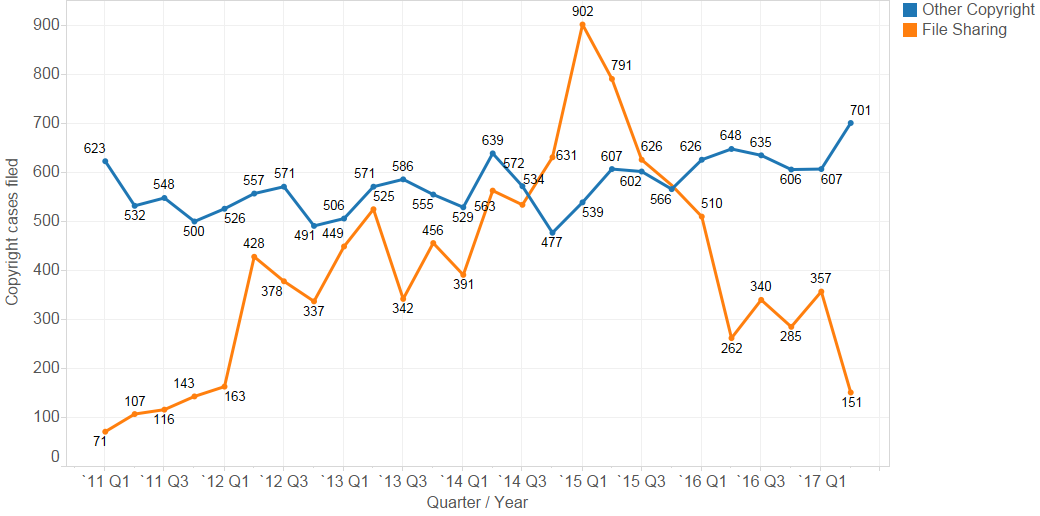
Fig. 9: Copyright cases filed by Malibu Media, 20011 – 2017 Q1, by quarter (no cases filed in Q2 2017)
Securities Litigation
The second quarter of 2017 is the second consecutive record-high, with 438 cases filed in the first quarter and 445 cases filed in the second quarter of 2017.
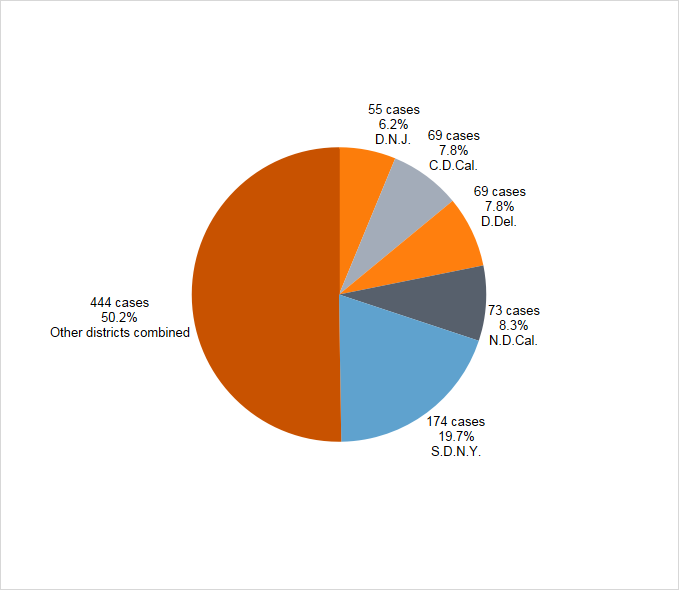
The top five districts accounted for roughly half (49.8%) of the cases filed in the first half of 2017. Those districts are the Southern District of New York (19.7%), the Northern District of California (8.3%), the Central District of California (7.8%), the District of Delaware (7.8%) and the District of New Jersey (6.2%).
Fig. 10: Securities cases filed, 2011 – 2017 Q2, by quarter
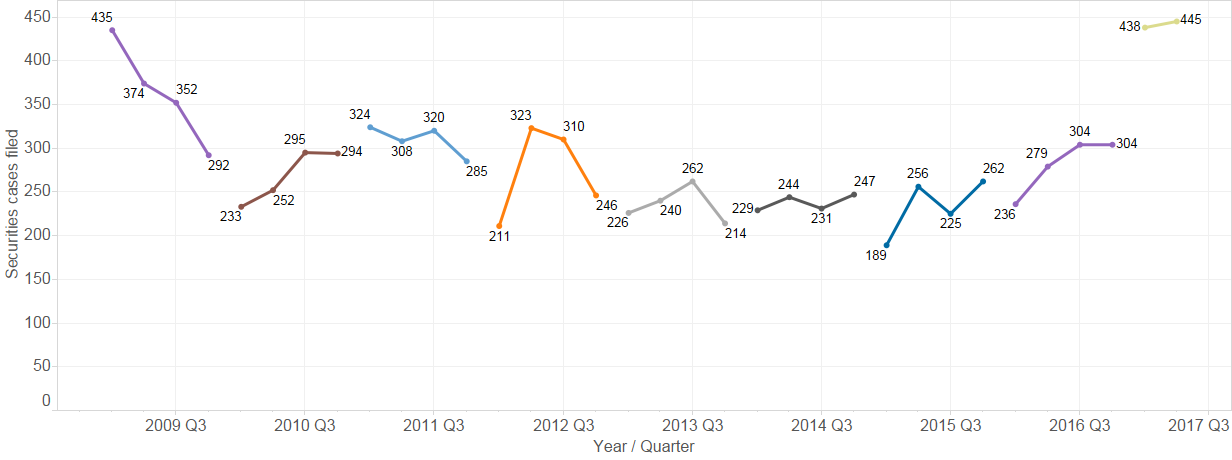
Fig. 11: Top districts by securities cases filed, 2017 Q2, by quarter
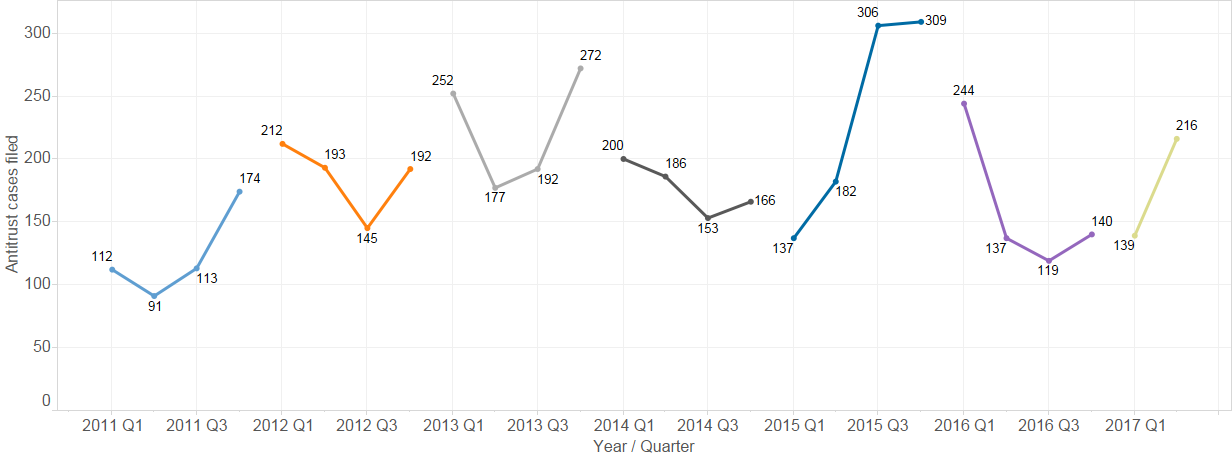
Antitrust Litigation
216 cases were filed in the second quarter of 2017, up significantly from the previous four quarters (137, 119, 141, 140 cases), but is still down from the peak that occurred from the third quarter of 2015 and into the first quarter of 2016.
Fig. 12: Antitrust cases filed, 2011-2017 Q2, by quarter