Patent Litigation
District Court
In the final quarter of 2016, plaintiffs filed 1,140 patent cases, bringing the total for 2016 to 4,520 patent cases.
The fourth quarter represents a slight increase over the third quarter’s 1,126 cases, but overall litigation in 2016 has declined by a moderate 22% from 2015 (when 5,823 cases were filed). Month by month, 2016 has been relatively consistent compared to the dramatic spike in 2015 caused by the end of Form 18.
Fig. 1: Patent cases filed, 2011 – 2016, by quarter
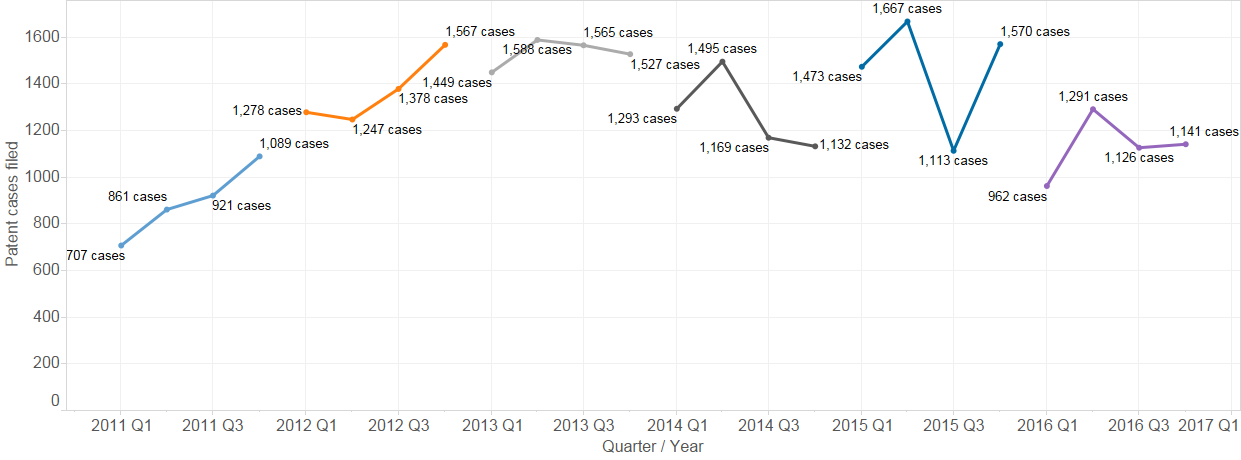
Fig. 2: Patent cases filed, 2011-2016, by year

Fig. 3: Patent cases filed, 2014 – 2016, by month

The majority of patent litigation filed in 2016 (36.4% of cases) was filed in the Eastern District of Texas. The District of Delaware remained the second most frequently used jurisdiction, with just over 10% of cases filed in 2016.
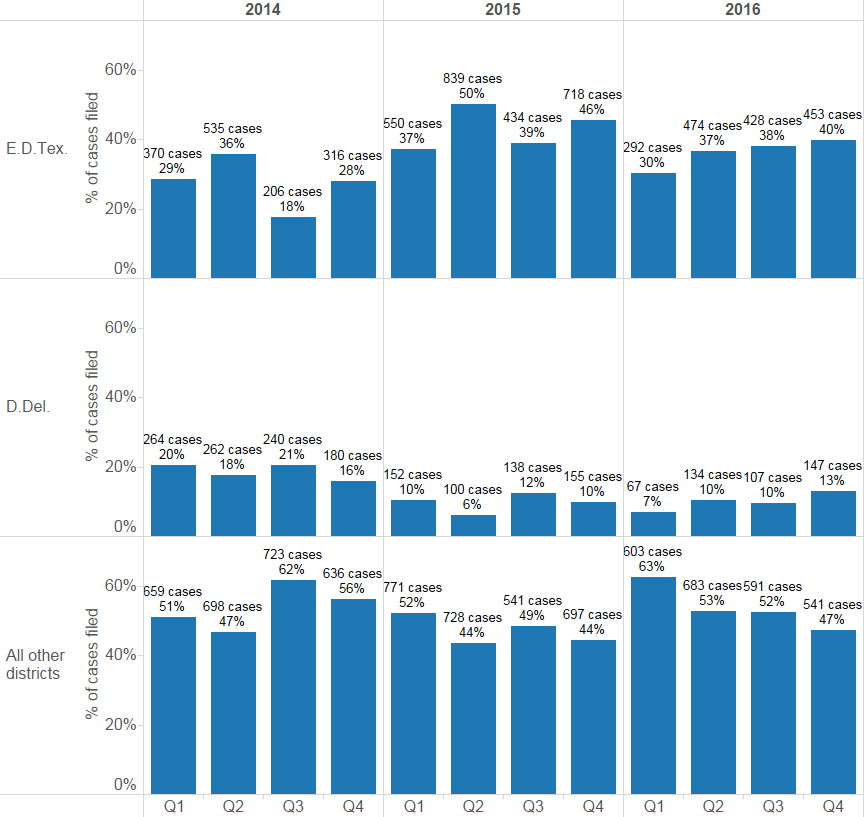
The percentage of cases filed in the Eastern District of Texas has also been increasing, from around 30% in the first quarter, to 40% in the fourth quarter of 2016.
Fig. 4: Top districts by patent cases filed in 2016
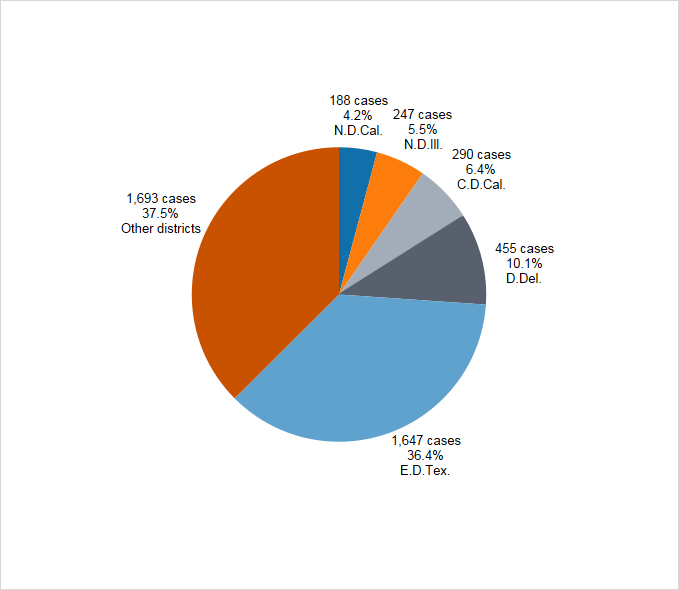
Fig. 5: Eastern District of Texas and District of Delaware, 2014-2016 by quarter
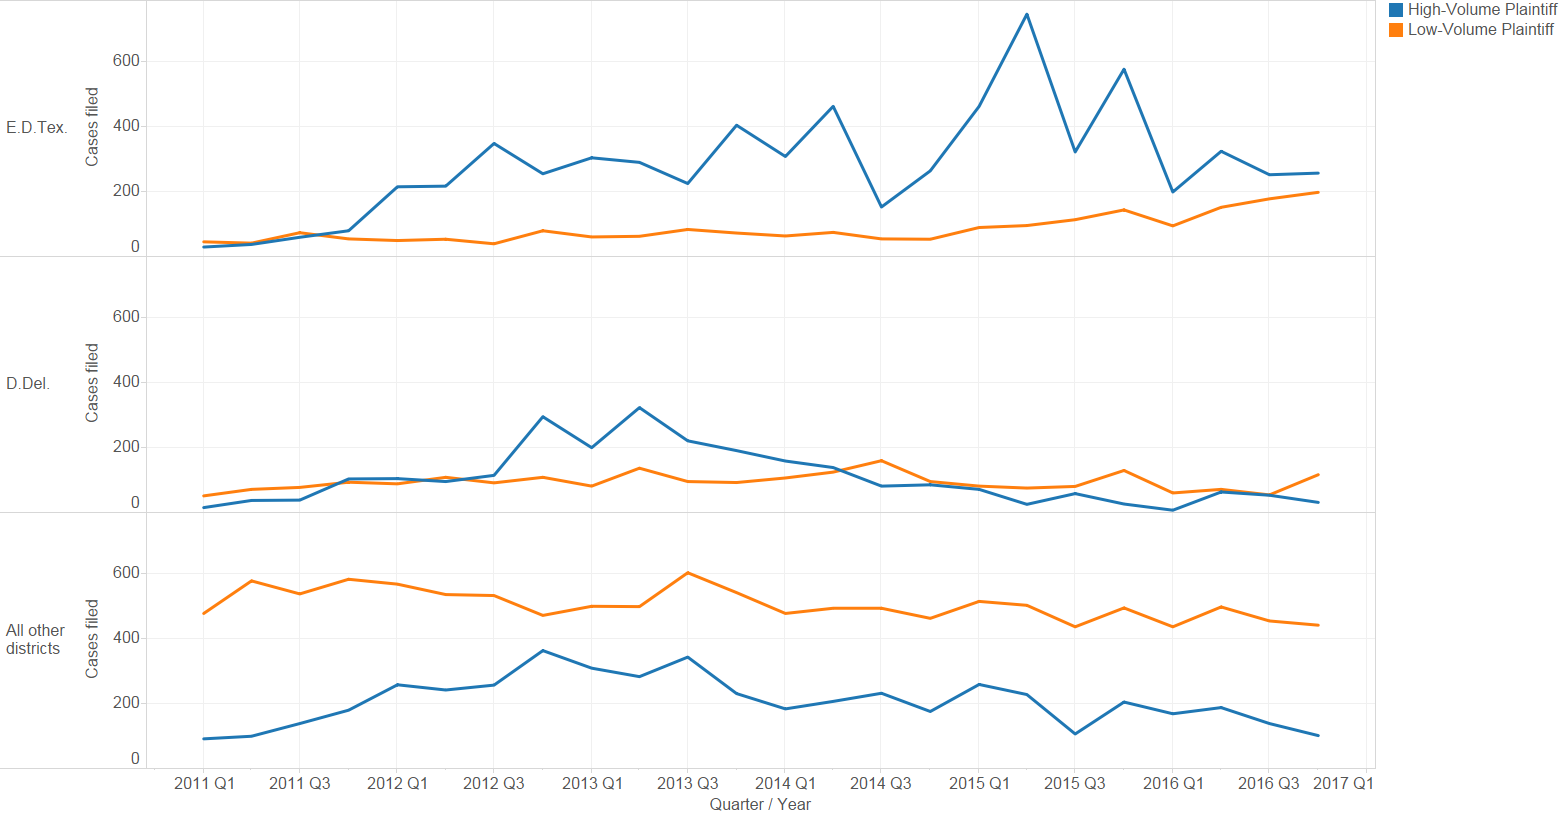
To gain more insight into patent litigation, cases can be broken down according to whether the plaintiff* has filed at least 10 other cases within a 365 day span (high volume) or not (low volume). This simple behavioral measure reveals that patent litigation in the Eastern District of Texas and in the District of Delaware differs starkly from litigation in other districts: a far higher percentage of E.D.Tex. and D.Del. litigation is from high volume plaintiffs.
Moreover, in those two districts, high volume plaintiffs drive most of the volatility in case filings, both in time (i.e. spikes and dips within Eastern Texas) and between districts (i.e. Delaware’s decline corresponds to the rise in Eastern Texas). In contrast, litigation by low volume plaintiffs is relatively consistent across time and districts.
Although high volume cases in the fourth quarter may be undercounted due to the timing of filing campaigns, there was, nonetheless, less high volume activity in 2016 than in 2015.
* or more precisely, whether a plaintiff (or declaratory judgement defendant) has filed (or been subject to a declaratory judgment case) in at least 10 other cases within 365 days. Although the values of 10 and 365 are somewhat arbitrary, the conclusions hold for a range of these values.
Fig. 6: Plaintiff volume class, 2011-2016
The Patent Trial and Appeal Board
The fourth quarter of 2016 saw 414 Inter Partes Review (IPR) petitions filed at PTAB, and 16 Covered Business Method (CBM) reviews.
Although the fourth quarter represents a decrease over the third, the last three quarters of 2016 have generally seen a higher level of IPR activity roughly consistent with the pattern of the previous year.
Fig. 7: CBM and IPR petitions, 2012 – 2016, by quarter

Trademark Litigation
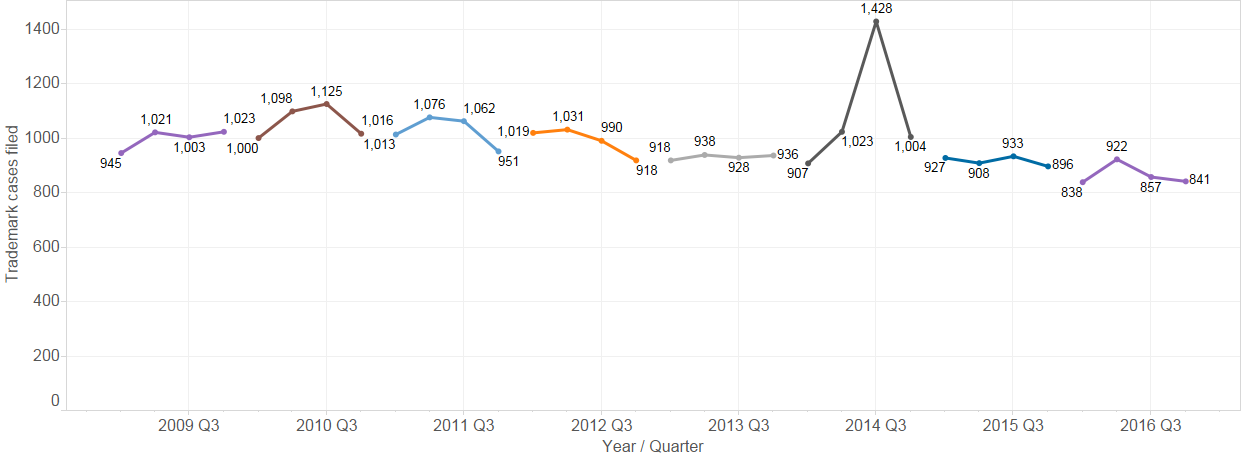
Trademark litigation filing trends have been more predictable than patent trends (or copyright). The filing of new trademark cases has declined at a very slight rate over the last few years. The fourth quarter of 2016 (841 cases) represents a slight decrease over the third (857 cases).
For the curious, the spike in trademark case filings seen below in the third quarter of 2014 was driven by a flood of cases filed in the District of Minnesota against the National Football League, generally by former players over usage of their likeness. These cases account for about 461 of the 1,425 cases filed in Q3 2014. Without these cases, Q3 2014 appears otherwise consistent with the quarters surrounding it.
Fig. 8: Trademark cases filed, 2009 – 2016, by quarter
Copyright Litigation
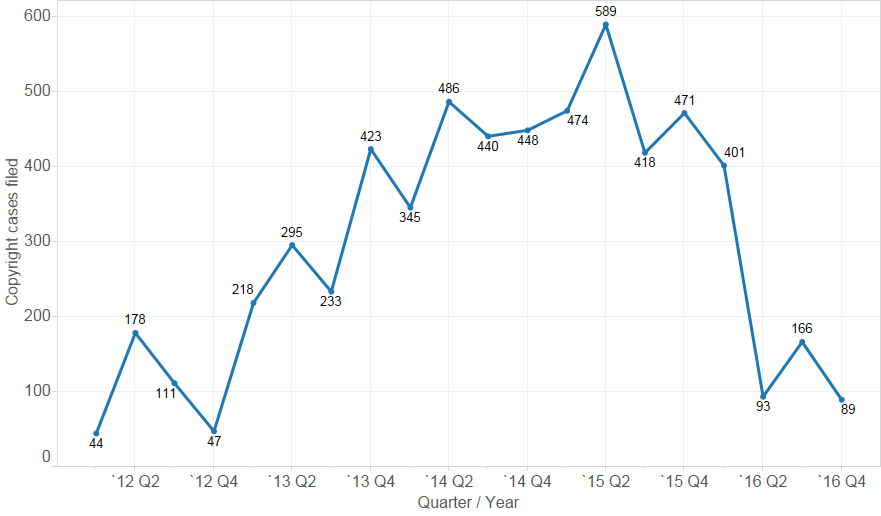
Lex Machina divides copyright litigation in the U.S. district courts into two subtypes: file sharing cases (those having John Doe or anonymous defendants and accusations based on file sharing technology such as BitTorrent), and all of the other, more traditional cases. As explained in Lex Machina’s Copyright Litigation Report, these cases follow very different dynamics.
Since its apogee in Q1 of 2015, the number of file sharing cases filed each quarter has declined until reaching a low of 249 cases in Q2 of 2016. The last two quarters have remained relatively low.
File sharing cases are largely driven by Malibu Media.
Fig. 9: Copyright cases filed, 2011 – 2016, by quarter

Fig. 10: Copyright cases filed by Malibu Media, 20011 – 2016 Q3, by quarter
Securities Litigation
The fourth quarter of 2016 continues the trend of increased filings in 2016, ending with 324 new cases – a level not seen since 2012.
The top five districts accounted for roughly half (52.2%) of the cases filed in 2016. Those districts are the Southern District of New York (20.2%), Northern District of California (10.6%), the Central District of California (7.7%), the District of New Jersey (5.4%) and the District of Massachusetts (3.8%)
Fig. 11: Securities cases filed, 20011 – 2016, by quarter
Fig. 12: Top districts by securities cases filed, 2016 Q1, by quarter

Antitrust Litigation
The fourth quarter of 2016 (148 cases filed) represents an increase from the previous two quarters (137 and 122 cases), but is still down from the peak that occurred from the third quarter of 2015 into the first quarter of 2016.
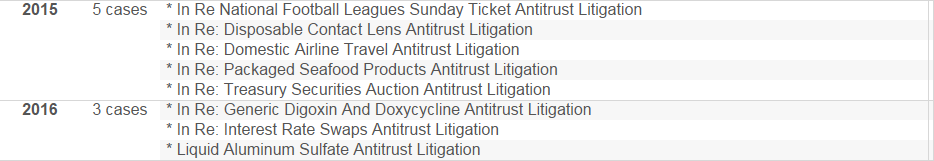
Three new antitrust master cases were filed in 2016, down from the 5 in 2015.
Fig. 13: Antitrust cases filed, 2011-2016, by quarter
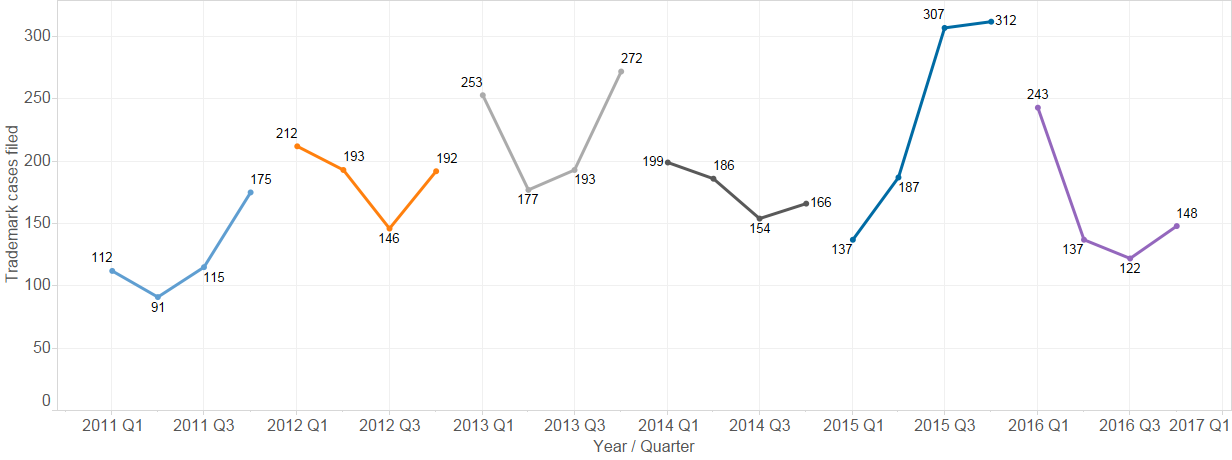
Fig. 14: Antitrust MDL master cases filed, 2015-2016