Patent Litigation
District Court
For a more in-depth consideration of patent litigation trends around the Supreme Court’s landmark T.C. Heartland ruling, see this companion post.
995 patent cases were filed in the third quarter of 2017, a 12.3% decrease from the number of cases filed in last quarter. A drop from the second to third quarter has occurred in each of the past 4 years. Relative to the number of cases filed in 2016 through the third quarter, filings in 2017 are down 8.4%.
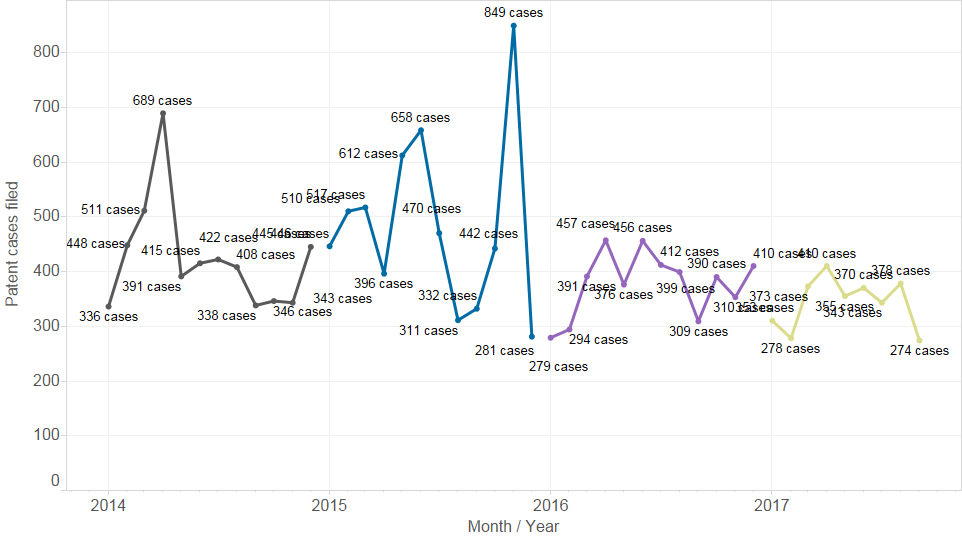
Figure 2 below shows that 2017 continues the pattern of relatively consistent monthly totals that has persisted since the dramatic spike in 2015 (caused by the end of Form 18).
Fig. 1: Patent cases filed, 2011 – 2017 Q3, by quarter
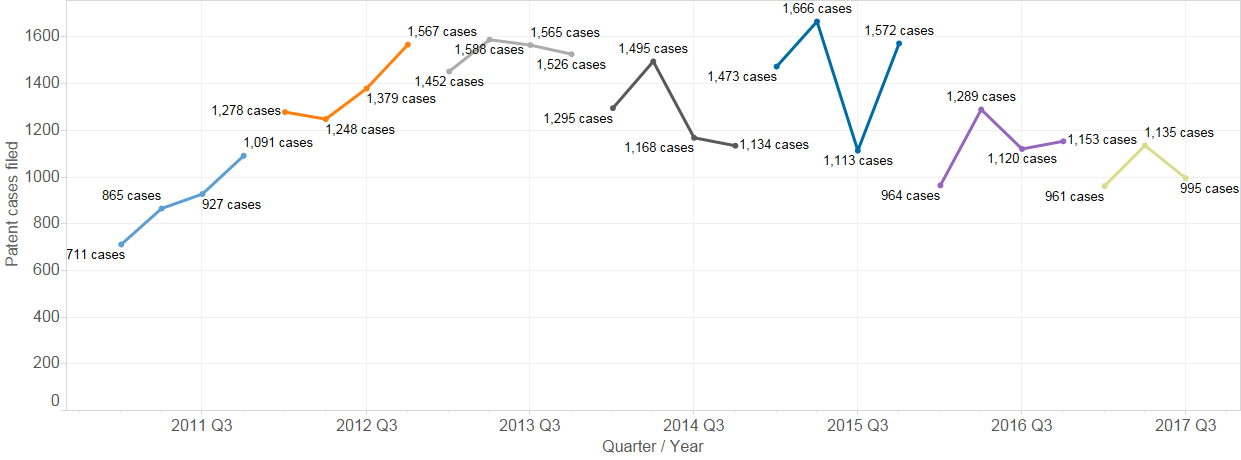
Fig. 2: Patent cases filed, 2011 – 2017 Q3, by month
The Patent Trial and Appeal Board
While the first quarter of 2017 saw a record high number Inter Partes Review (IPR) petitions filed at PTAB (548 petitions), the second quarter and third quarters have each seen a drop in filings (438 petitions in Q2 and 381 in Q3).
This crest/trough may be related to the Supreme Court’s granting of certiorari in Oil States Energy Servs., v. Greene’s Energy Grp. in June 2017 – a case in which petitioners argue that IPR is unconstitutional, as a non-Article III forum extinguishing a property right without a trial by jury.
There was only 1 Covered Business Method (CBM) review filed, the lowest number since the review has been offered.
Fig. 3: CBM and IPR petitions, 2012 – 2017 Q3, by quarter

Trademark Litigation
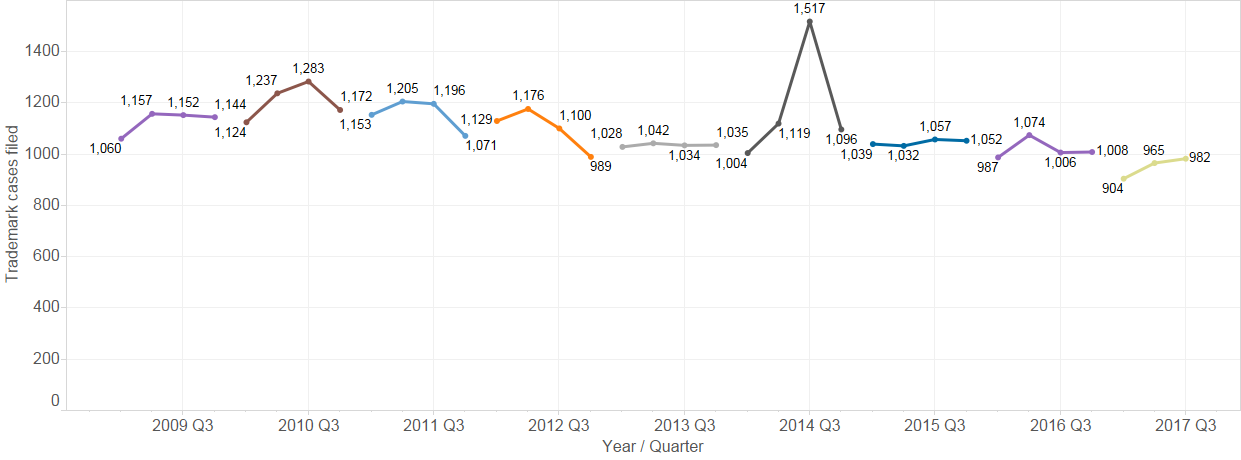
Trademark litigation filing trends have been more predictable than patent trends (or copyright). The filing of new trademark cases has declined at a slight rate over the last few years. The third quarter of 2017 (982 cases) represents a continuation of this trend.
For the curious, the spike in trademark case filings seen below in the third quarter of 2014 was driven by a flood of cases filed in the District of Minnesota against the National Football League, generally by former players over usage of their likeness. These cases account for about 461 of the 1,517 cases filed in Q3 2014. Without these cases, Q3 2014 appears otherwise consistent with the quarters surrounding it.
Fig. 4: Trademark cases filed, 2009 – 2017 Q3, by quarter
Copyright Litigation
Lex Machina divides copyright litigation in the U.S. district courts into two subtypes: file sharing cases (those having John Doe or anonymous defendants and accusations based on file sharing technology such as BitTorrent), and all of the other, more traditional cases. As explained in Lex Machina’s Copyright Litigation Report, these cases follow very different dynamics.
From its apogee in Q1 of 2015, the number of file sharing cases filed each quarter declined steadily until Q2 of 2016 when it oscillated around 300 cases. However, In the second and third quarters of 2017, the levels have dropped again with only 152 file sharing cases were filed in Q2 and 140 cases filed in Q3.
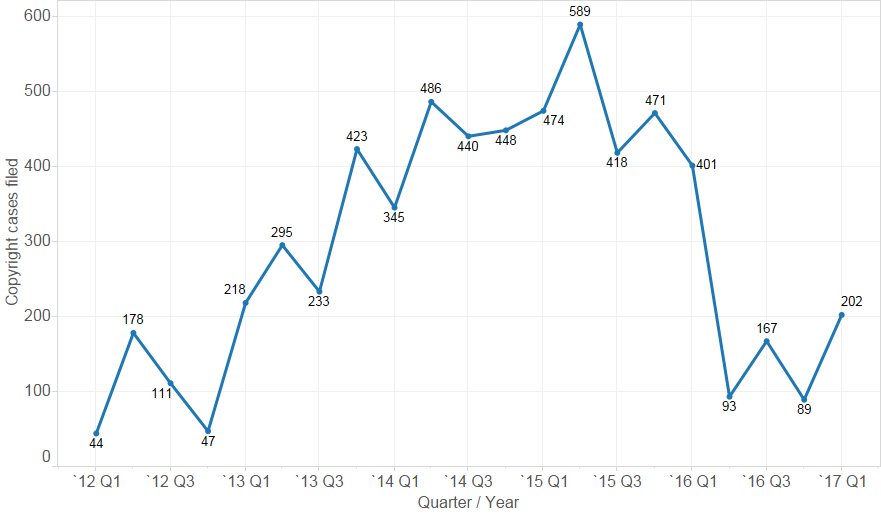
File sharing cases have been largely driven by Malibu Media (as shown in Figure 9 below), but Malibu Media did has not filed a single case since Q1 2017.
Fig. 5: Copyright cases filed, 2011 – 2017 Q3, by quarter
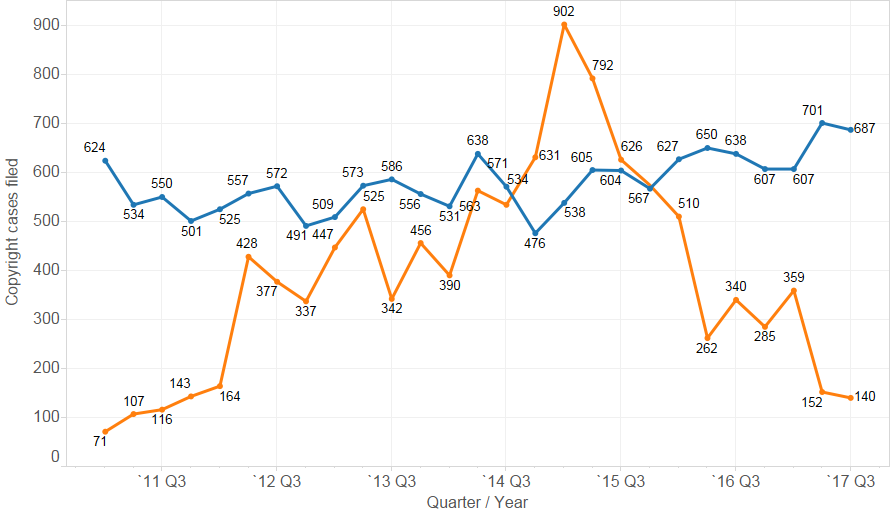
Fig. 6: Copyright cases filed by Malibu Media, 20011 – 2017 Q1, by quarter (no cases filed in Q2-Q3 2017)
Securities Litigation
The second quarter of 2017 is the third consecutive record-high, with 432 cases filed in the first quarter and 428 cases filed in the second quarter, and 466 cases filed in the third quarter of 2017.
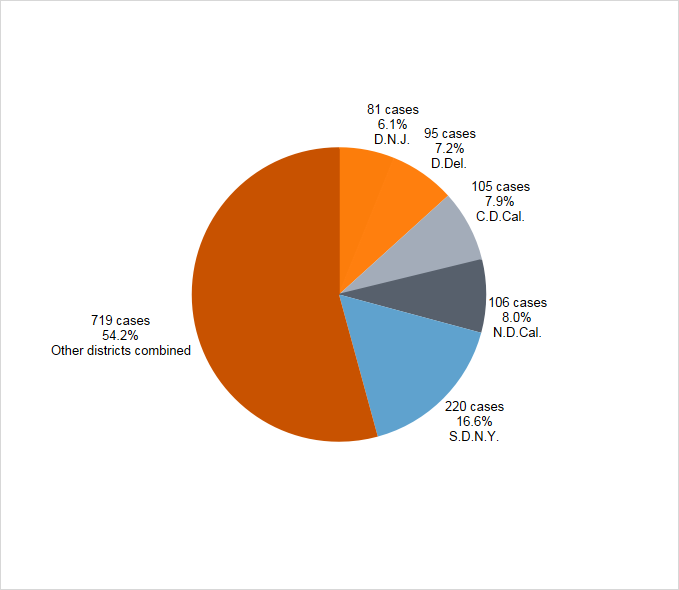
The top five districts accounted for just under half (45.8%) of the cases filed in the first half of 2017. Those districts are the Southern District of New York (16.6%), the Northern District of California (8%), the Central District of California (7.9%), the District of Delaware (7.2%) and the District of New Jersey (6.1%).
Fig. 7: Securities cases filed, 2011 – 2017 Q3, by quarter
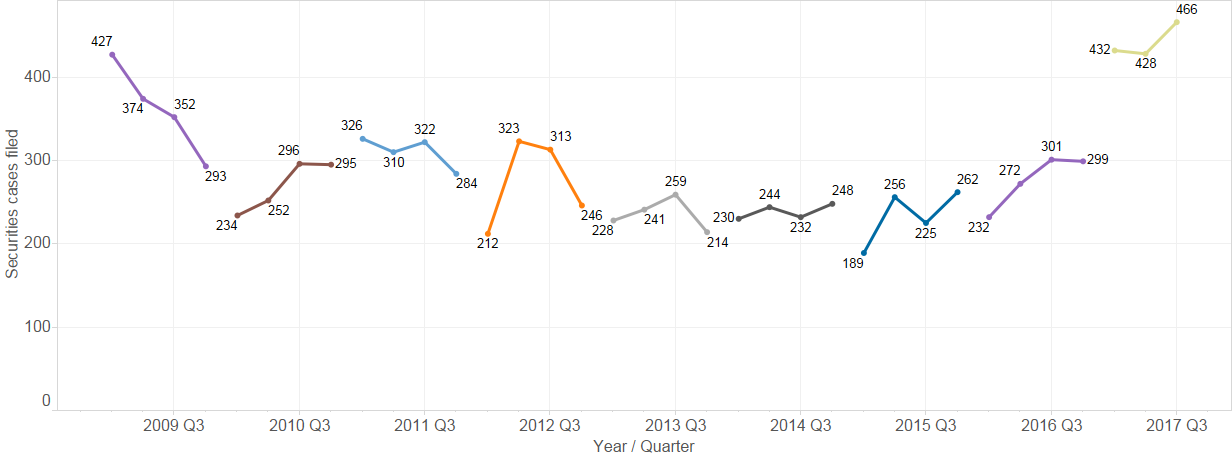
Fig. 8: Top districts by securities cases filed, 2017 Q3, by quarter
Antitrust Litigation
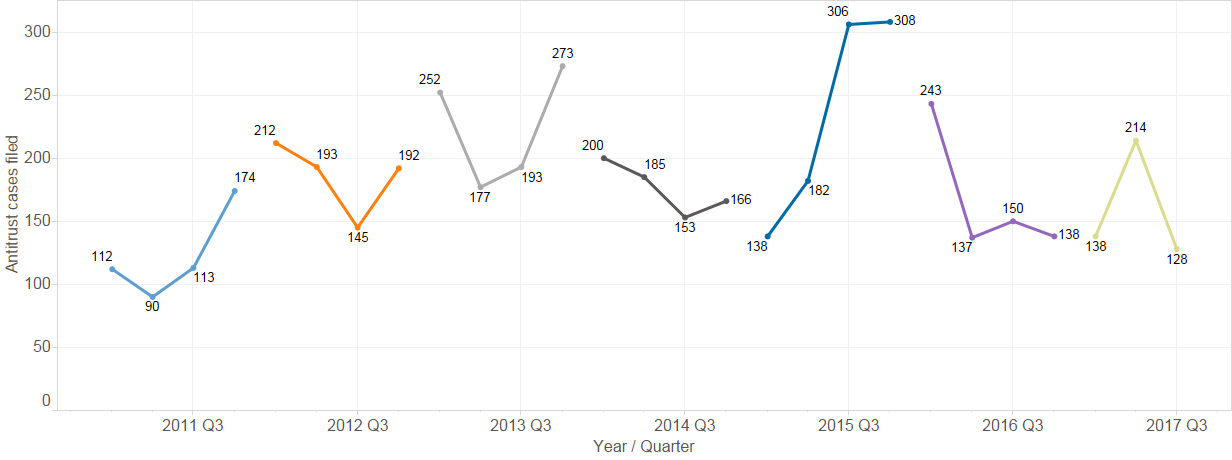
128 cases were filed in the third quarter of 2017, more in line with the previous quarters (137, 150, 138, 138 cases) than the last (214 cases), but is still down from the peak that occurred from the third quarter of 2015 and into the first quarter of 2016.
Fig. 9: Antitrust cases filed, 2011-2017 Q3, by quarter
Commercial Litigation
The number of Commercial cases filed each quarter has generally declined over the last several years. The 1,480 cases filed in the third quarter of 2017 is the lowest quarter total on record (back to 2009). Lex Machina’s Commercial cases involve claims for breach of contract or business torts between or among businesses. The decline in these cases has correlated with recovering economy in the years since 2009.
Fig. 10: Commercial cases filed, 2011-2017 Q3, by quarter

Employment Litigation
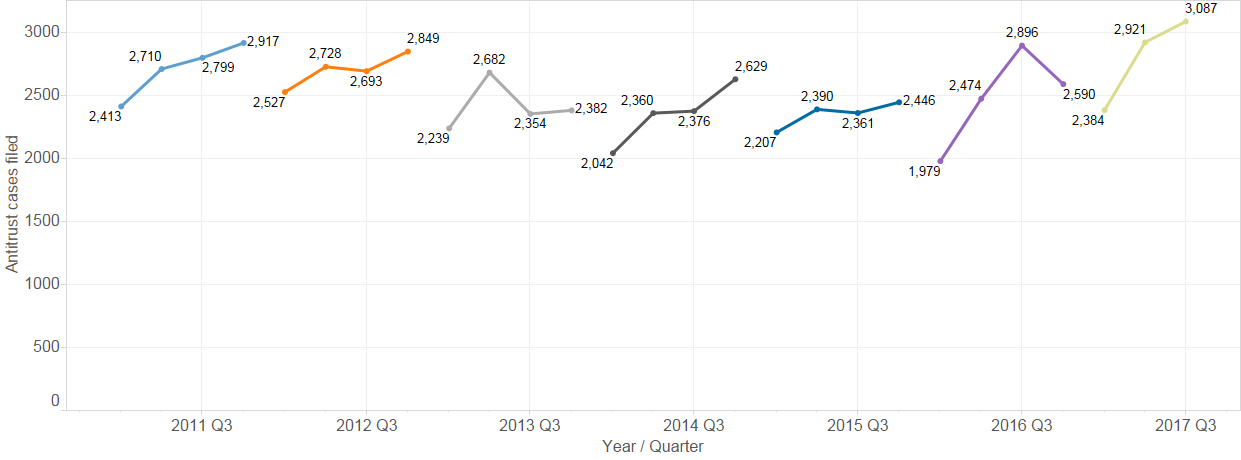
Employment litigation hit a record high of 3,087 cases filed in the third quarter of 2017. Lex Machina defines employment litigation as cases involving claims of discrimination, harassment and/or retaliation brought under Federal civil rights laws.*
* Cases involving wage and hour claims are coming soon.
While this information is important for lawyers and companies involved in employment litigation, it is difficult to analyze the broader policy implications. To sue in District Court, an employee must first file a claim with the Equal Employment Opportunity Commission (EEOC) and receive a favorable outcome in the form a right-to-sue letter. The employee must then find a lawyer to take the case, requiring either money to hire one, or a sufficiently promising set of facts for a contingency fee arrangement to be worth an attorney’s time. Even after the case is filed, the employee must endure without settling for years and prevail with a jury before one can conclude an injury has actually occurred.
Fig. 11: Employment cases filed, 2011-2017 Q3, by quarter