In the last post, I covered the final 2014 filing statistics – a low November and an uptick in December that was unable to make up for the slow months since June, leaving 2014 down 18% from 2013.
Here, let’s look more closely at these trends, how they’re calculated, and what they mean for your business. In particular, I explore the effects of such events as the AIA, the availability of PTAB, and the Alice v. CLS Bank decision, and how those events are represented in different metrics.
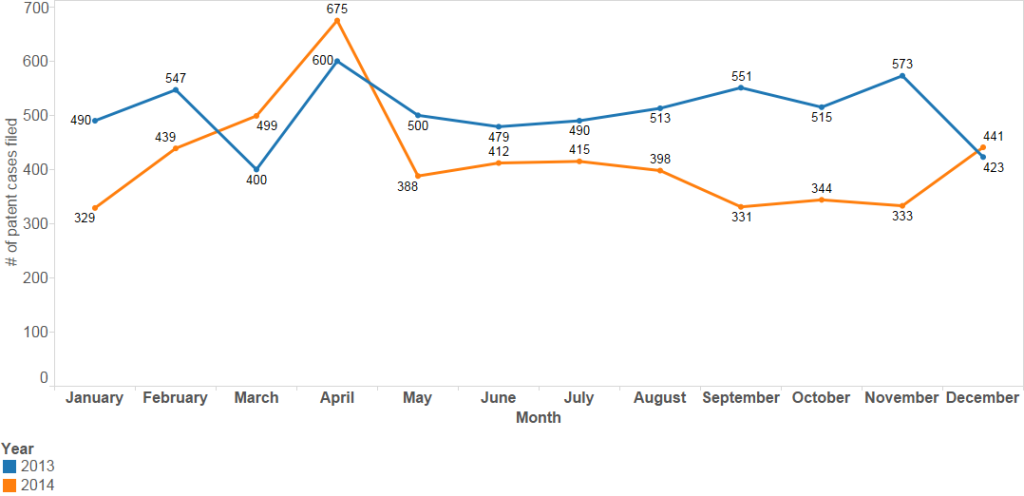
Fig. 1: 2013 (in blue) compared to 2014 (in orange) patent case filings, monthly
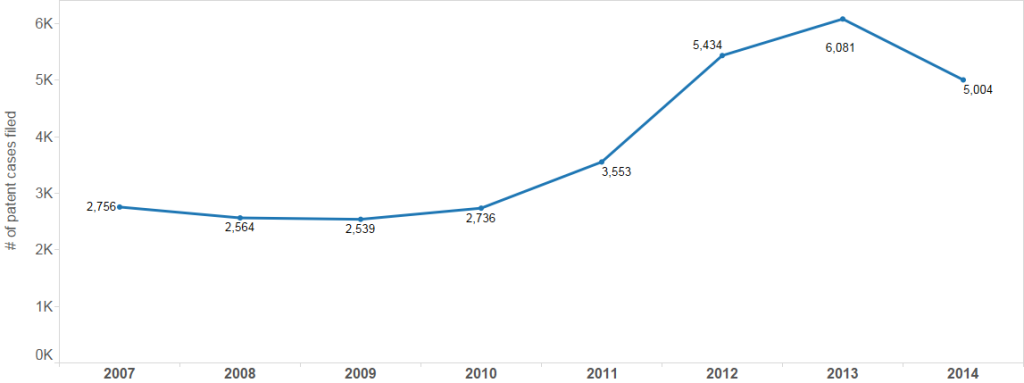
Fig. 2: New patent case filings, yearly, 2007-2014
From a historical perspective, 2014 is the first year of decrease following about 4 years of increase in patent litigation case filings. The increase coincides with the Americans Invent Act (AIA), which became effective in September 2011 and limited to the number of defendants a plaintiff could sue in a single case.
Beyond the AIA anti-joinder rules, there are at least two other changes to the landscape in recent years: the availability of the review procedures at the Patent Trial and Appeal Board (PTAB) of the USPTO, and the Supreme Court’s decision of the Alice v. CLS Bank case in June of 2014 . The Alice case dealt with patentable subject matter, the Court invalidated claims of a software patent as too abstract, and many wondered what effect it would have on patent litigation.
This post digs deeper on two questions related to these events and the rise and fall of patent case filings. The first question probes how well the metric of “patent cases filed” relates to the business of litigation, and whether there are better things to measure the present and future workload of the court system (and its practitioners).
Secondly, I ask what these other metrics can tell us about how the system has changed in response to events like the AIA, PTAB, and the Alice v. CLS Bank decision, and where it might be going.
With district court patent litigation filings remaining at lower levels not seen since 2010-2011, and PTAB petitions on the rise, legal analytics can provide the tools to recognize these shifts and harness them to your benefit.
* * *
I. Patent Cases Filed and the effects of the AIA
As a metric for the business of litigation, the number of patent cases filed is a basic indicator. However, the AIA’s anti-joinder rules make case filing rates from before its enactment in 2011 incomparable with those from afterwards. For example, the AIA’s restriction on suing multiple defendants in the same case means that a plaintiff would have to file more patent cases in 2014 than it would have in 2010 to sue the same number of defendants.
Looking at the number of cases filed from 2007 through 2014, there’s a huge increase around the time the AIA became effective in September 2011.
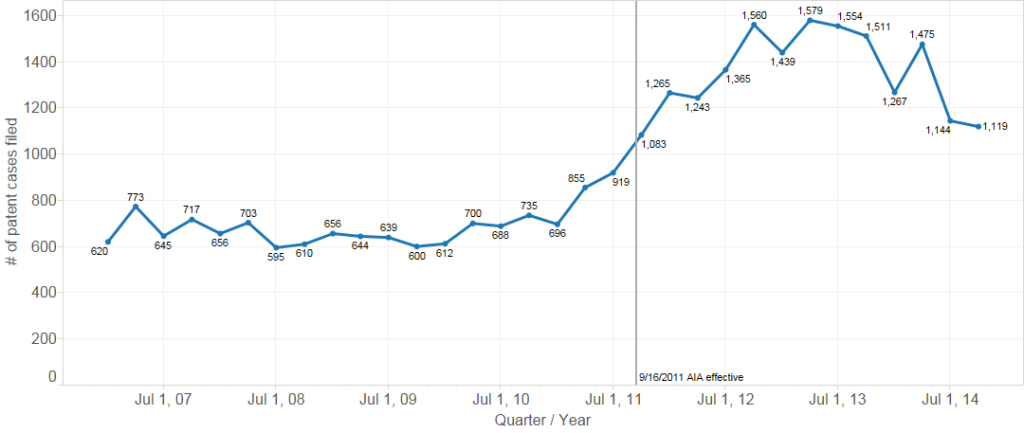
Fig. 3: Patent cases filed, quarterly, 2007-2014
How much of this increase in cases filed was caused by the AIA? And what does that tell us about the low filing numbers of recent months?
In order to understand the increase in litigation and what happens afterwards, it helps to count litigation in a way that is not affected by the AIA’s change of rules. As I have suggested in past posts, one such technique is counting each defendant in a case separately; I call this counting defendant-case pairs. Thus Plaintiff P suing A, B, and C in one case before the AIA would count the same as 3 pairs of P suing A, B, and C separately in different cases after the AIA.
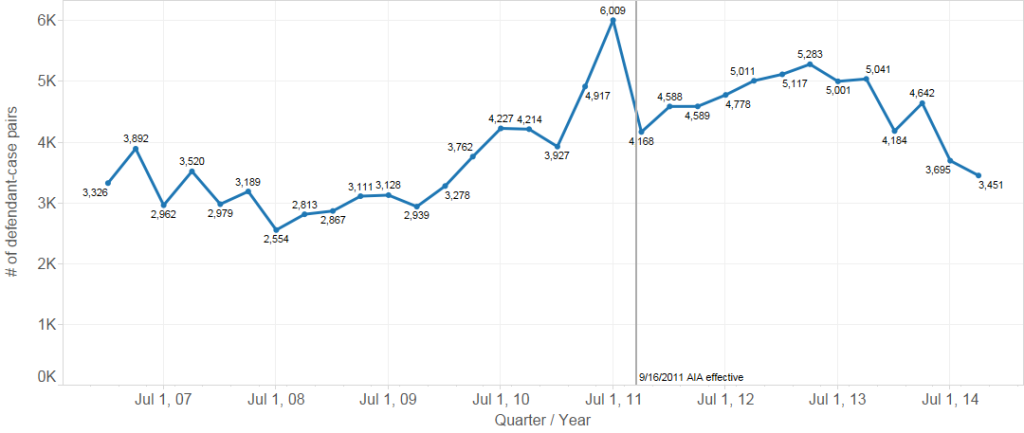
Figure 4: Defendant-case pairs, quarterly, 2007-2014
Aside from the previously discussed spike immediately before the AIA became active, Figure 4 (defendant-case pairs), compared to Figure 3 (cases filed), shows a less dramatic rise, both prior to the AIA between 2008 and 2011, and after the AIA’s effective date from 2011 to mid 2013. Measured by defendant-case pairs, the AIA did not dramatically reduce patent case filings, as the quarters from late 2011 to mid 2013 follow a consistent trajectory those from 2009 to early 2011.
This data also shows that litigation dropped in the last half of 2014 to a level more commensurate with 2009 and 2010 than Figure 3 (case filings alone) would suggest, since Figure 3 is subject to the case-filing-inflation of the AIA.
For practitioners and other participants in the court system, this contraction suggests that there are fewer patent cases, with greater competition by outside counsel over those cases, resulting in more leverage for inside counsel choosing firms.
II. Quantifying district court litigation to compare with PTAB
In addition to changing the joinder rules, the AIA introduced a new forum: the Patent Trial and Appeal Board (PTAB). Through the new Inter Partes Review (IPR) and Covered Business Method review (CBM) mechanisms, the PTAB allows potential patent defendants to litigate the validity of a patent on an expedited schedule and with less expense than a district court case; the PTAB does not rule on patent infringement.
We’re excited at Lex Machina for the upcoming release of our PTAB features, and this seems like a good opportunity to preview some of the data behind those features. Figures 5 and 6 below show the new filings for Covered Business Method (CBM) and Inter Parties (IPR) reviews – the two dominant forms of review at the PTAB.
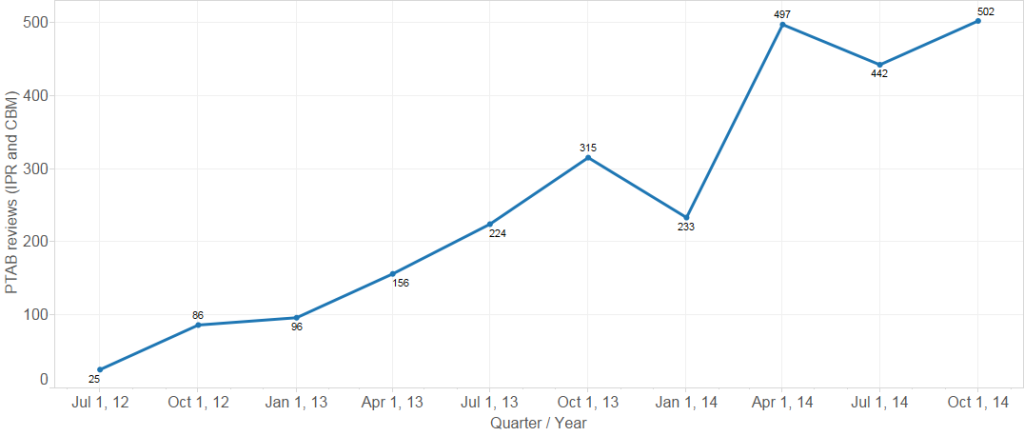
Fig. 5: PTAB IPR and CBM reviews, quarterly, 2011-2014
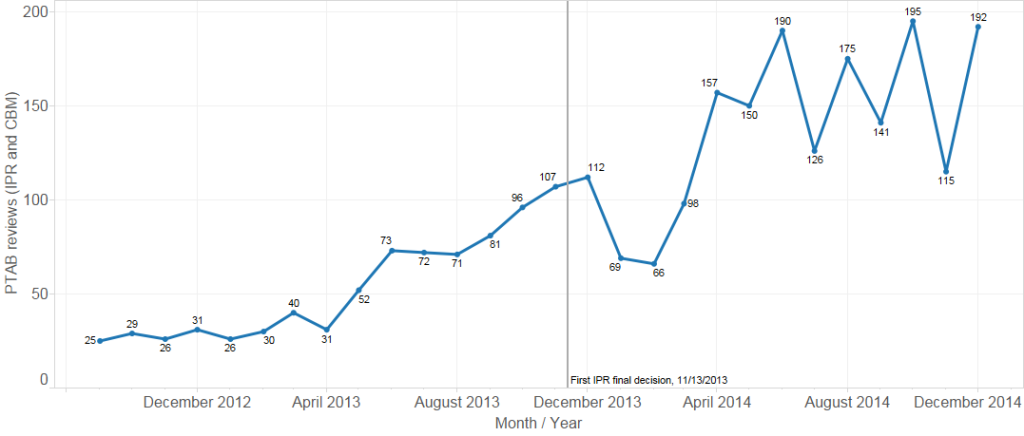
Fig. 6: PTAB IPR and CBM reviews, monthly, 2011-2014
These two figures show that usage of the IPR and CBM reviews has rapidly gained steam since they became available in September 2012. Although the second half of 2014 was uneven month-over-month, in aggregate the PTAB has not seen the same drop-off as district court litigation over the same period.
While counting district court litigation as defendant-case pairs (Fig. 4) accounts for the effects of the AIA, comparing it with PTAB reviews requires a further adjustment. Because PTAB reviews pertain to a single patent, below I’ve multiply counted each defendant-case pair, once for each asserted patent, so I’m essentially counting by unique combinations of patent, defendant, and case — patent-defendant-case combos for short.
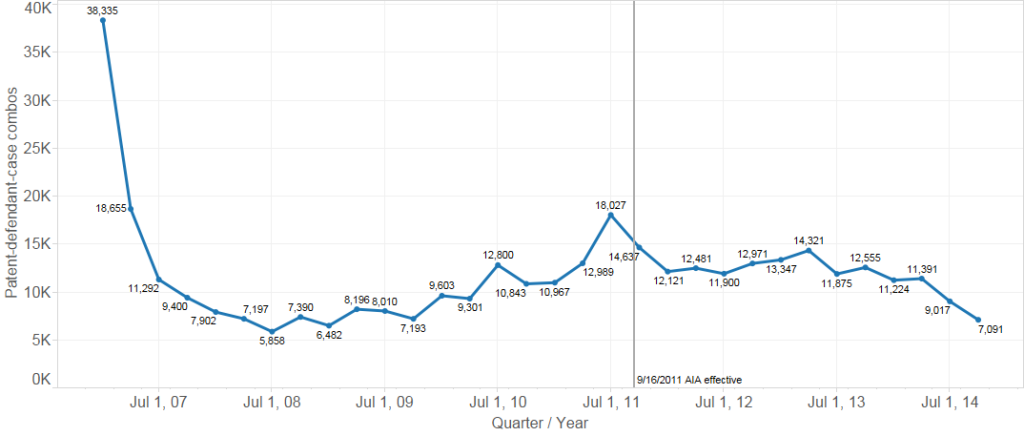
Fig. 7: Patent-defendant-case combos, quarterly, 2007-2014
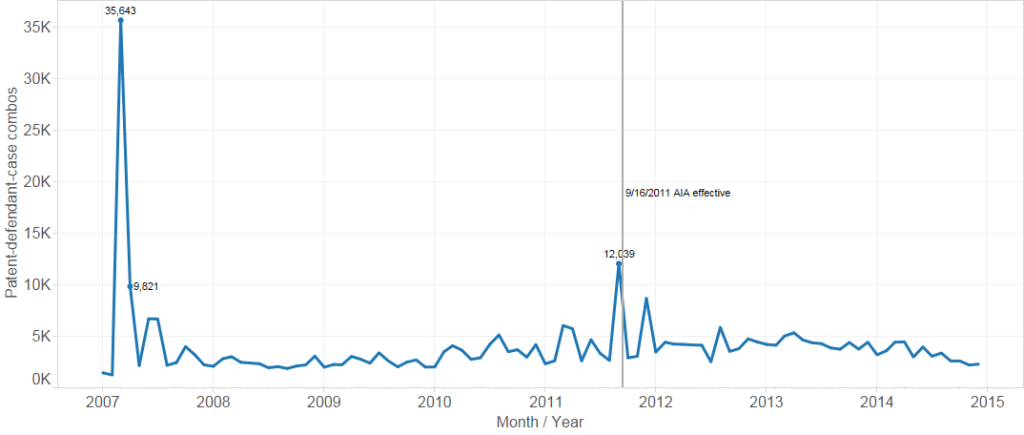
Fig. 8: Patent-defendant-case combos, monthly, 2007-2014
As an aside, the enormous 2007 spike, more clear in the month-by-month view of Figure 8, was driven by the large number of asserted patents per case (and the large number of cases) in the Ronald A. Katz litigation. A second spike, immediately prior to the effective date of the AIA in late 2011, correlates with patent holders’ last chance to sue large numbers of defendants in a single case.
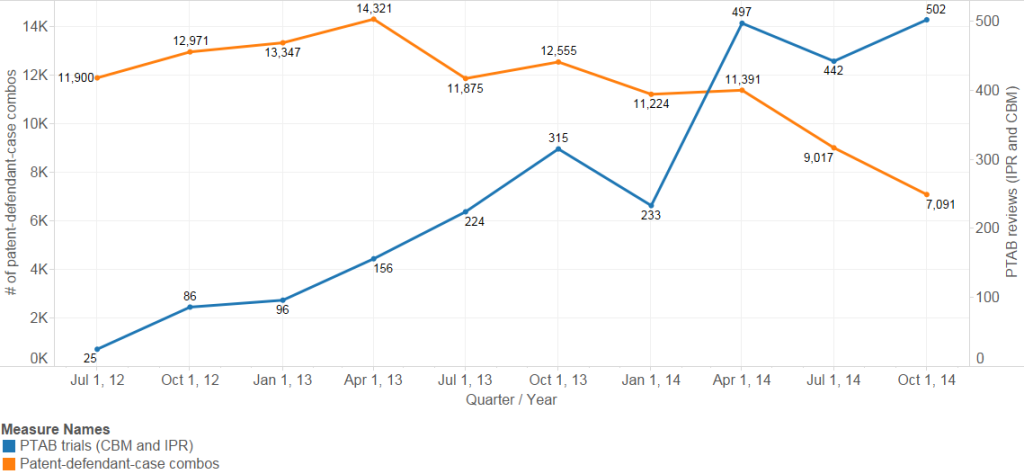
Fig. 9: Comparing PTAB reviews to patent-defendant-case combos, quarterly, 2012-2014
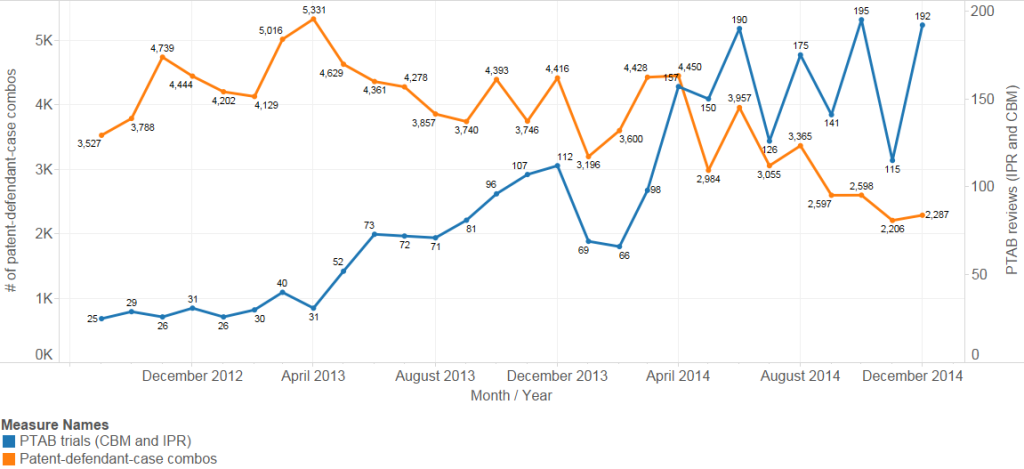
Fig. 10: Comparing PTAB reviews to patent-defendant-case combos, monthly, 2011-2014
This graphic compares PTAB trials (in blue) with patent-defendant-case tuples (in orange). Note that the purpose of Figures 9 and 10 is to show the relative movement of the two, not their absolute relationship. As the separate vertical scales indicate, there are significantly more patent infringement cases than PTAB reviews.
Because PTAB trials generally occur between two parties and over a single patent, this methodology allows a more direct and accurate comparison of PTAB filing rates with U.S. District Court filings rates.
PTAB filings rose sharply between February and June 2014 and remained relatively high for the duration of the year, correlating with the district court litigation tail off beginning in April 2014. Although the PTAB and district courts are not strict alternatives to each other (in the sense that district court actions are generally filed by the patent-rights-holder, while PTAB proceedings are instigated by the would-be accused), the correlation between PTAB’s rise and the district court’s lag seems too strong to ignore.
The surge in PTAB proceedings, especially at a time when business in the district courts is contracting, marks an important shift for practitioners. Counsel contemplating action in the new forum will need greater insight into the timing and success of PTAB reviews (as well as the unfamiliar and largely untested administrative judges presiding over them).
III. Case termination metrics and the Alice v. CLS Bank decision
As an alternative to case filing rates, some suggest looking at case terminations or the number of pending cases per month as a better metric for measuring the business of litigation (in particular, Jason Rantanen of Patently O, here and here).

Fig. 11: Cases terminated, quarterly, 2007-2014
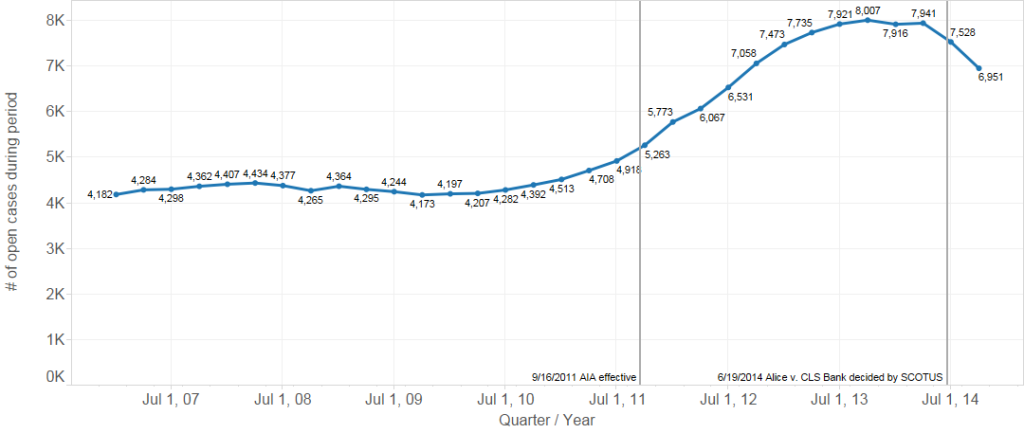
Fig. 12: Cases pending, quarterly, 2007-2014
While these additional metrics can be revealing in some circumstances, new case filings have several advantages over them for measuring the basic business of litigation. First, new case data is forward looking – a newly filed case will likely generate work for lawyers, courts and judges over coming weeks and years – and thus a better predictor of the future workload on the system. New case data also provides better data because case terminations are to some extent a function of the timing of case filings from much earlier. Moreover, termination timing can be constrained by contested outcomes and procedural rules that distribute settlement opportunities (and leverage) unevenly over the case calendar. The raw data for case terminations is also less precise: a judge may issue a dispositive ruling, but post-judgment proceedings over costs, fees, appeal, new trials, and such may cause the case termination date reported by PACER to lag behind the dispositive ruling. Measuring the number of cases currently pending in the court system, since it includes case termination, suffers from these same drawbacks.
Many have asked about quantifying the impact of the Alice v. CLS Bank decision decided by the Supreme Court on June 19, 2014. In Alice, the Court held a patent invalid for being too abstract, triggering fears that other similar patents may be held invalid. While the Alice decision does come at the start of a run of slow months for case filings, it does not correlate with a sudden mass exodus of cases from the system.
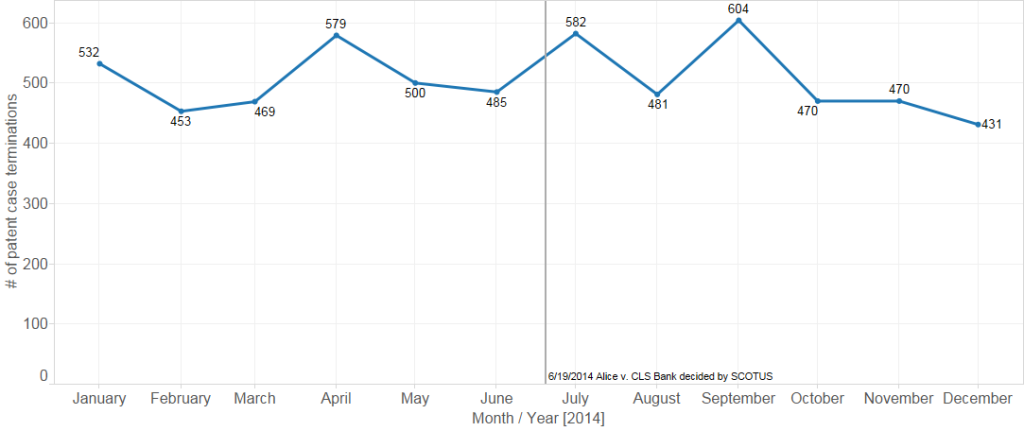
Fig. 13: Cases terminated, monthly, 2014 only

Fig. 14: Cases pending, monthly, 2014 only
Indeed, while district courts invalidated more than double the number of patents under § 101 in the second half of 2014 than in the entire previous year, those decisions represent a very small number of cases relative to the volume of litigation in the system.
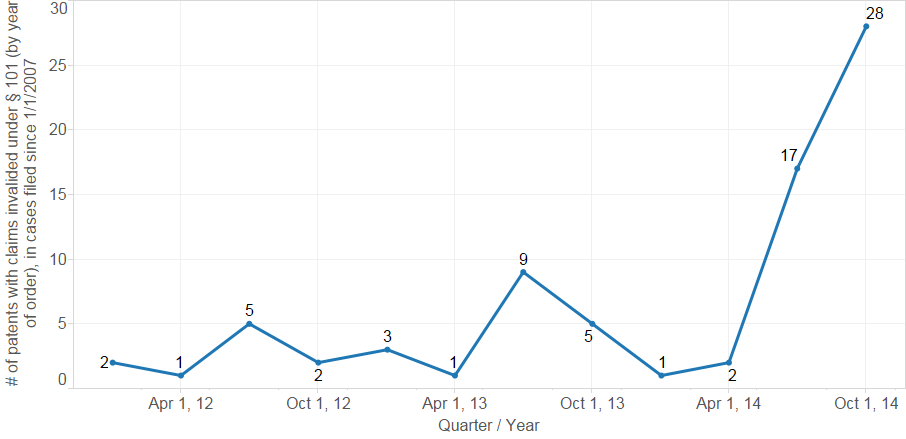
Fig. 15: Patents invalided under 35 U.S.C. § 101 (patentable subject matter), by quarter of the invalidating order, 2012-2014
While the various possible causes of the district court litigation slow-down, including the Alice decision, the rise of PTAB reviews, among other developments (e.g. the Highmark/Octane case decided by the Supreme Court in April 2014, relating to attorneys fees) remain difficult to precisely weigh, it’s clear after six months of lackluster business that the landscape is shifting. Patent litigation work is decreasing, and what remains is becoming defrayed between the new PTAB and district courts. Against the contracting number of district court cases and the unfamiliarity of PTAB, the only thing that’s certain is the need to remain informed.