Patent Litigation
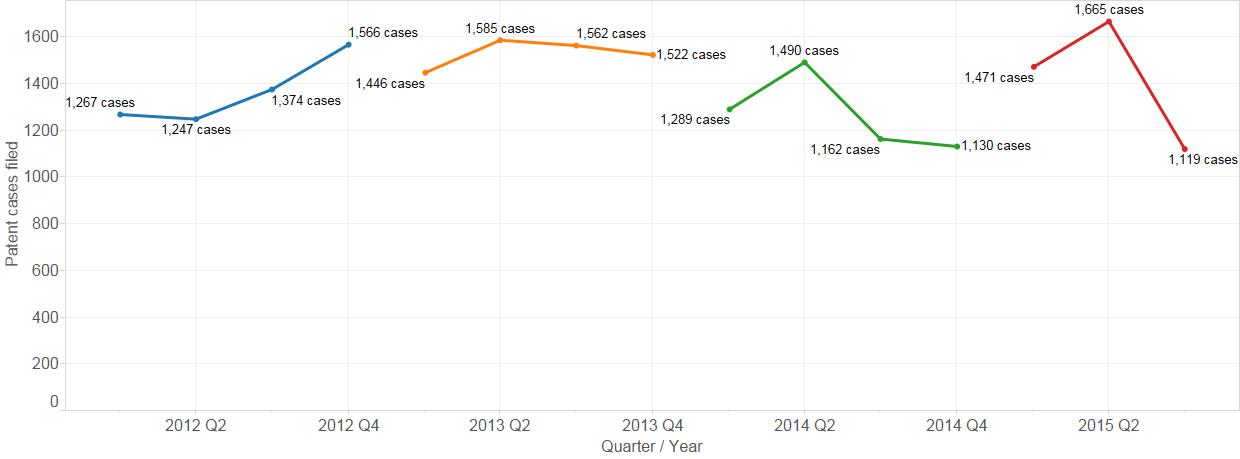
Patent litigation in the U.S. district courts dropped in the third quarter of 2015: only 1,119 cases were filed in Q3, a 33% drop from the record-setting 1,665 cases filed in the second quarter.
Fig. 1: Patent cases filed, 2012-2015
Compared to previous years, each through its third quarter, 2015’s patent case filings represents an increase from 2014 but do not quite reach the levels seen in 2013.
Fig. 2: Patent cases filed, by Q1-Q3 of year, 2012-2015

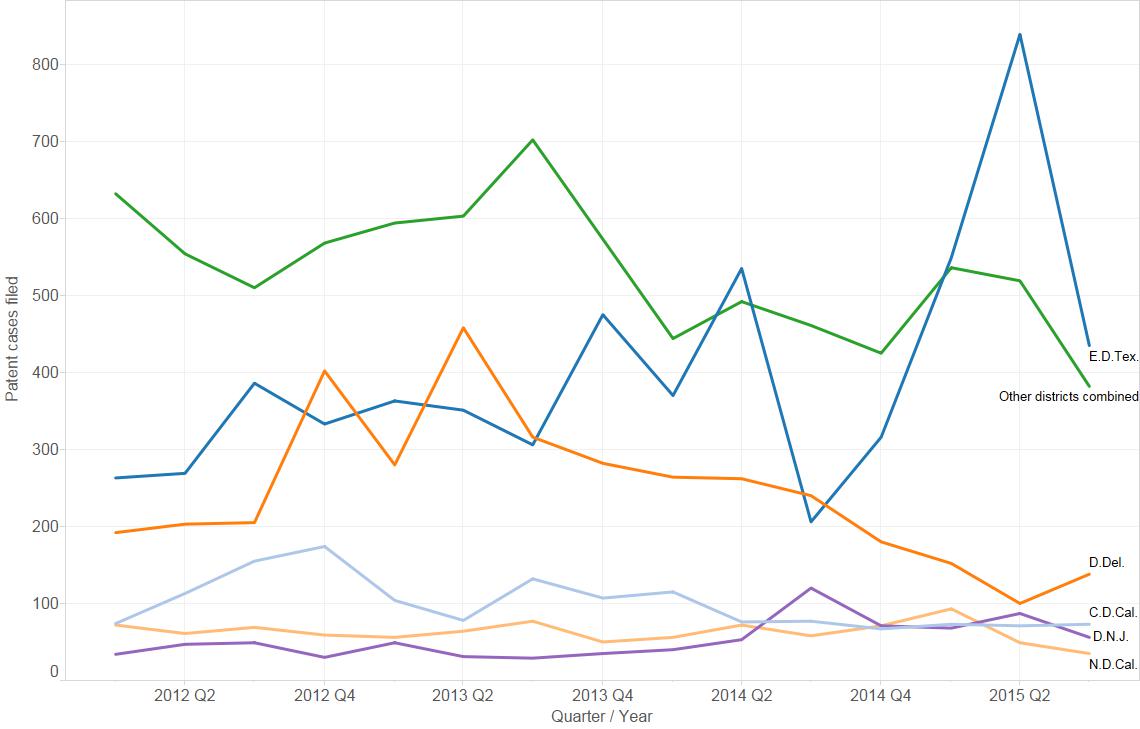
Examining trends among the top five districts (by 2015 patent case filings) shows that the Q3 drop off is driven in large part by the Eastern District of Texas. The Eastern District saw a nearly 50% drop from its record peak in Q2 (839 cases) down to 435 cases in Q3 2015.
Patent case filings in the District of Delaware increased in Q3 by 38% (from 100 in Q2 to 138 in Q3). This increase is the first quarter-to-quarter increase for the District of Delaware since early 2013.
Fig. 3: Patent case filed in top districts, 2012-2015
Patent Trial and Appeal Board (PTAB) Petitions
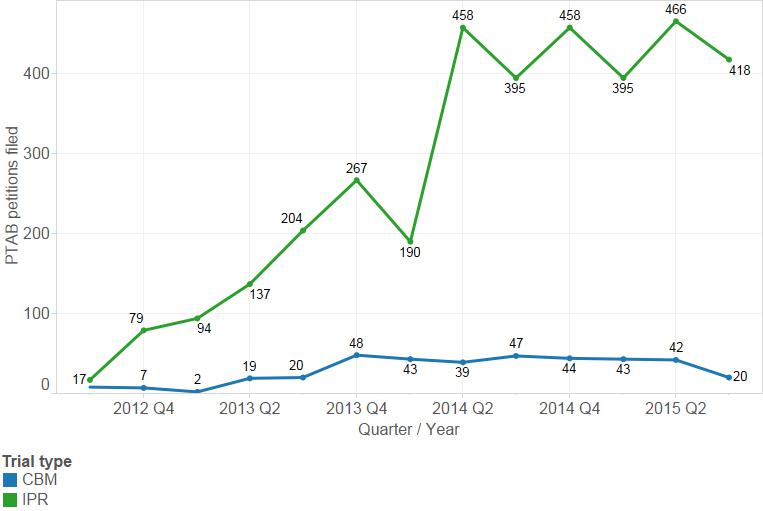
Petitions to the Patent Trial and Appeal Board (PTAB) have decreased in Q3 of 2015.
Inter Partes Reviews (IPRs) have dropped from 466 in Q2 to 418 in Q3 (10%), but this decrease is firmly within the established trend going back to mid 2014. Covered Business Method reviews (CBMs) have historically been filed at a much lower rate. However, the 20 petitions filed in Q3 represents more than a 50% drop from Q2 (as well as from the long-running trend of roughly 40 CBMs filed per quarter).
Fig. 4: Petitions at PTAB, 2012-2015
Trademark Litigation
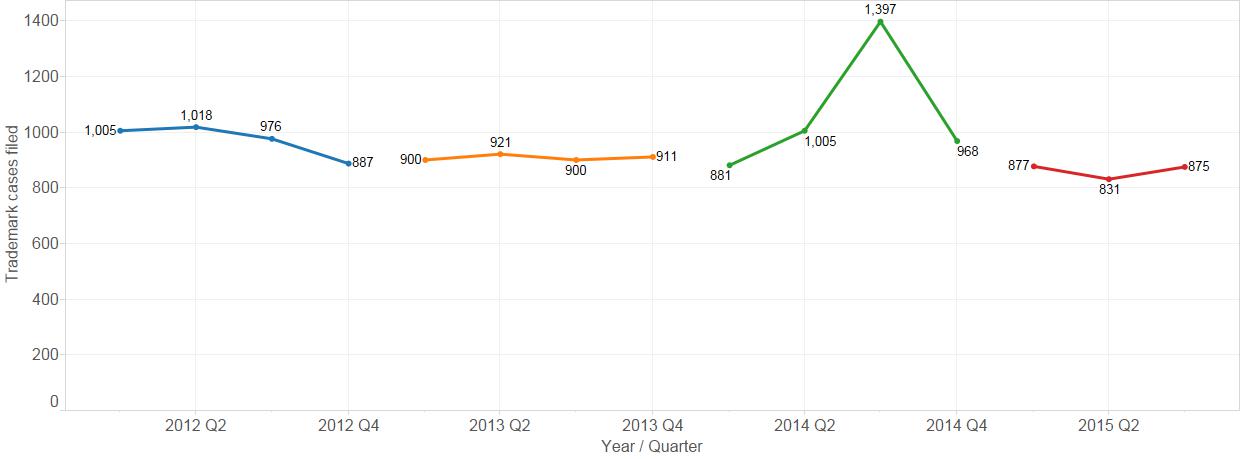
Trademark litigation in the U.S. district courts has been very steady in 2015, and Q3 continues that trend: 875 trademark cases were filed in Q3, compared to 831 in Q2 and 877 in Q1.
For the curious, the spike in trademark case filings seen below in the third quarter of 2014 was driven by a flood of cases filed in the District of Minnesota against the National Football League, generally by former players over usage of their likeness. These cases account for about 461 of the 1,397 cases filed in Q3 2014. Without these cases, Q3 2014 appears otherwise consistent with the quarters surrounding it.
Fig. 5: Trademark cases filed, 2012-2015
Copyright Litigation
Lex Machina divides copyright litigation in the U.S. district courts into two sub-types: file sharing cases (those having John Doe or anonymous defendants and accusations based on file sharing technology such as BitTorrent), and other, more traditional cases. As explained in the Copyright Report, these cases follow very different dynamics.
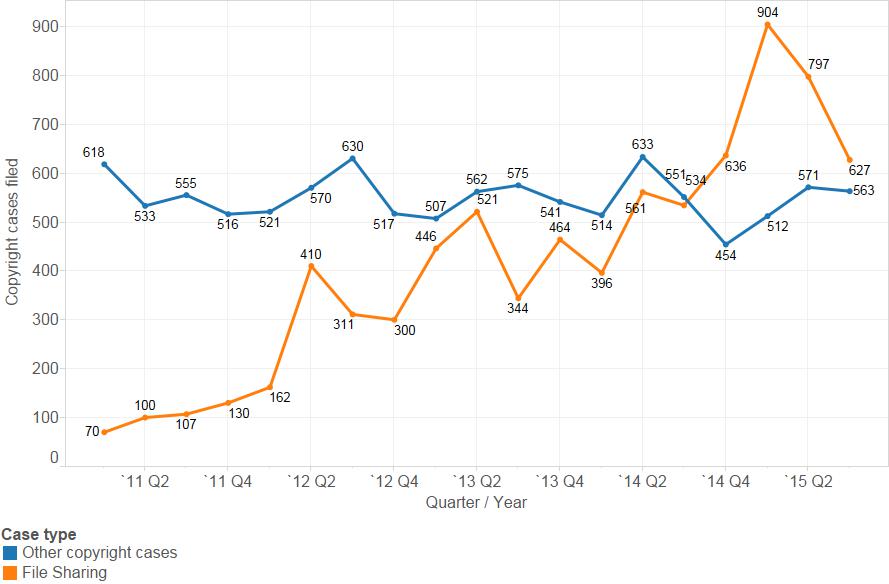
Case filings for traditional copyright cases fell slightly in Q3 of 2015 to 563 cases – a 1.4% decrease from Q2 when 571 cases were filed. Despite this change, the last few years of copyright case filings has been quite consistent, generally hovering around 500-600 cases a quarter.
In contrast, new file sharing cases have dropped much more sharply – declining 21% from 797 in Q2 to 627 in Q3. Although file sharing cases remain a majority of copyright cases filed, this marks the second quarter of decrease in file sharing cases from their peak of 904 cases in Q1 2015.
Fig. 6: Copyright cases filed, 2012-2015
Note: Lex Machina’s numbers for past quarters sometimes change slightly over time. This flux results in part from court clerks back-dating filings, but small changes can also come from improvements to Lex Machina’s data, either via upgraded automated recognition systems or via human curation. These fluctuations are sufficiently small as to be insignificant to the trends discussed here.