Since the beginning of the pandemic, Lex Machina has regularly analyzed its effects on different sectors of litigation in both federal and state courts. Now, nearly a year into the pandemic, Lex Machina conducted another survey of our data to provide an analysis of evolving trends in employment cases. Lex Machina’s analysis of employment litigation in federal district courts revealed an increase in employment cases caused by COVID-19 (“COVID Employment Cases”) during November to December of 2020. To read our previous posts on the impact of the pandemic on different segments of litigation, visit our blog. To access analytics on how the federal district court system has been impacted by COVID-19 by viewing up-to-date month-over-month case filings and total numbers of COVID-19 cases by practice area, visit Lex Machina’s publicly available COVID-19 Impact Analyzer.
Key Takeaways:
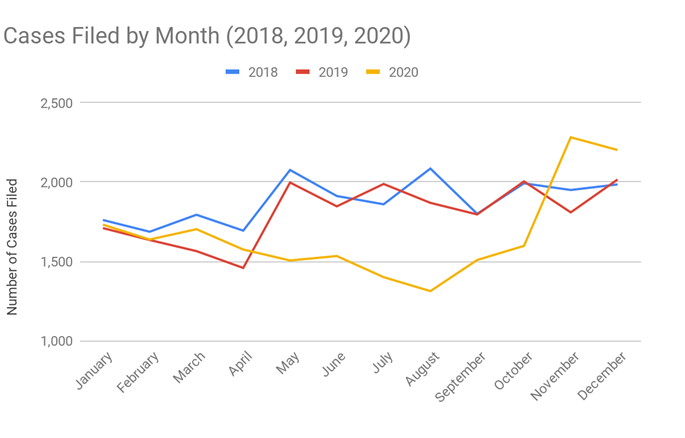
- There was a significant increase in the number of total employment cases filed in federal district courts in November and December of 2020 compared to the same months in 2019 and 2018.
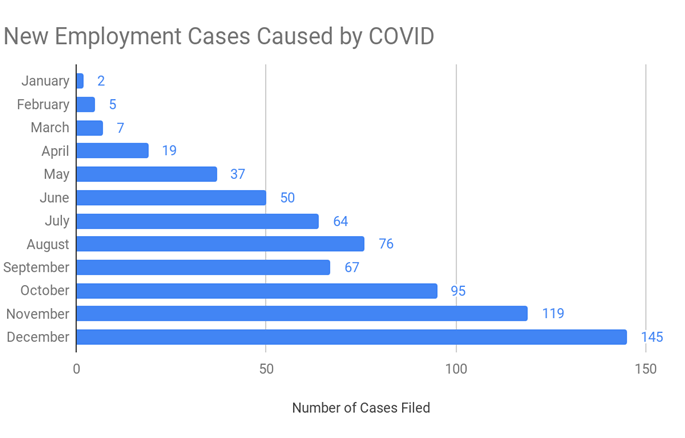
- There was a significant increase in the number of COVID Employment Cases filed in federal district courts in November and December of 2020 compared to the preceding months in 2020, during the ongoing course of the pandemic.
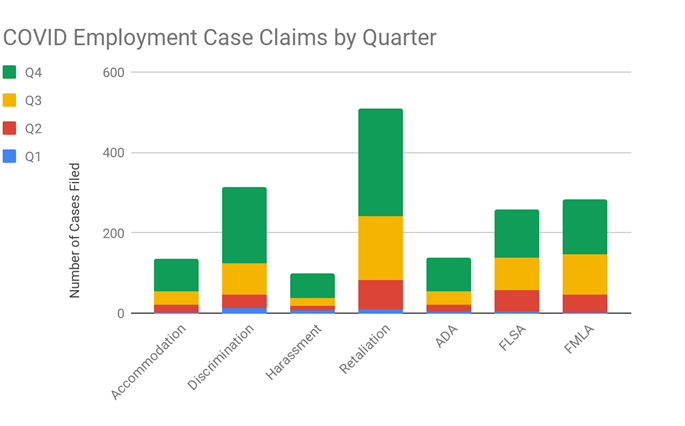
- The three most common claims involved in COVID Employment Cases were retaliation, discrimination, and FMLA claims.
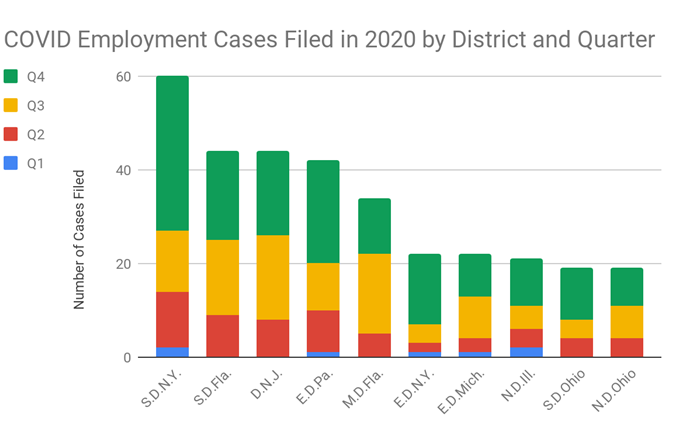
- The four districts with the highest number of COVID Employment Cases filed were the Southern District of New York, the Southern District of Florida, the District of New Jersey, and the Eastern District of Pennsylvania.
- Although the increased number of COVID Employment Cases filed towards the end of the year may be due to a number of factors including normal cyclical fluctuations, it is likely that the spike in COVID Employment Cases occurred at least partially as a result of a prolonged pandemic, a steadily increasing number of confirmed COVID cases, and a correlated growing familiarity with new workplace structures and protective workplace regulations.
Methodology
We used the COVID-19 tag to gain more information about trends in employment litigation. The COVID-19 tag captures cases filed January 1, 2020 or later, with complaint text that indicates the claims were caused and/or exacerbated by the circumstances of the COVID-19 pandemic. Specifically, our team of legal experts reviews every federal district court civil case complaint with pandemic-related keywords to verify whether the case satisfies either of these criteria:
- If not for the pandemic, the case would not have been filed, because the allegations are tied explicitly to circumstances created by the pandemic, or
- The factual description of the case explains how pandemic-related circumstances exacerbated the dispute.
Year-Over-Year Comparison of Employment Cases Filed in Federal District Courts
The table and graph below shows the number of new employment cases filed each month in 2018, 2019, and 2020 for the months of January through December. The data shows that unsurprisingly, the number of employment cases filed in 2020 trailed significantly behind the previous two years for the months of May to October, during the months following the beginning of pandemic restrictions and the economic downturn. However, there was a significant increase in employment cases filed in November and December 2020, both compared to previous months in 2020 and compared to the same months in the previous two years. The number of employment cases filed in November 2020 was 25% higher than the number filed in November 2019, and the number of employment cases filed in December 2020 was 8% higher than the number filed in December 2019. November 2020 saw the most employment case filings of any month in the last three years, followed by December 2020. As can be seen in the following section, at least one driving force behind these increases in case filings was the increase in COVID Employment Cases filed.
Greg Brumfield, our Legal Data Expert in Employment Law, noted that there is likely a combination of factors causing the spike in total employment case filings towards the end of the year. One driving force is the normal cyclical pressure of end-of-year deadlines that culminate in a higher number of case filings in November and December of most years generally. This factor is compounded in 2020 by the influx of additional COVID Employment Cases, as discussed in the following section, which resulted in higher numbers of cases filed in November and December 2020 compared to the previous two years.
Employment Cases Filed by Month (2018, 2019, 2020)
| 2018 | 2019 | Change | 2020 | Change | |
| January | 1,761 | 1,710 | -3% | 1,732 | 1% |
| February | 1,687 | 1,635 | -3% | 1,638 | 0% |
| March | 1,794 | 1,565 | -13% | 1,703 | 9% |
| April | 1,694 | 1,459 | -14% | 1,575 | 8% |
| May | 2,076 | 1,997 | -4% | 1,506 | -25% |
| June | 1,912 | 1,847 | -3% | 1,534 | -17% |
| July | 1,860 | 1,988 | 7% | 1,401 | -30% |
| August | 2,085 | 1,869 | -10% | 1,313 | -30% |
| September | 1,800 | 1,796 | 0% | 1,509 | -16% |
| October | 1,992 | 2,004 | 1% | 1,598 | -20% |
| November | 1,950 | 1,809 | -7% | 2,282 | 26% |
| December | 1,985 | 2,016 | 2% | 2,202 | 9% |

COVID Employment Cases Filed in Federal District Courts by Month
The chart below shows the number of COVID Employment Cases that were filed each month from January 2020 through December 2020. The number of COVID Employment Cases increased fairly steadily from two cases filed in January to 145 cases filed in December. We observed that one likely explanation for this trend is that at the onset of the pandemic, the workplace situations were still evolving. Employees in these new situations may not yet have been familiar with the relevant protective employment laws, particularly the new ones that were enacted in light of the pandemic. As a result, back in March or April, many employees might not have realized which claims were available to them. Unlike in other practice areas such as Contracts or Insurance, the plaintiffs bringing employment claims are typically individuals, and the filing trends will hinge strongly on their experience and knowledge.
However, in recent months, an increased number of refined complaints were filed (citing claims under the Family First Coronavirus Response Act (FFCRA), which provides direction for the administration of the Emergency Paid Sick Leave Act (EPSLA)). Therefore, the recent influx of COVID Employment Cases has demonstrated not only an increase in filing activity, but also an increase in the sophistication of the complaints. As the government provides more guidance regarding employee protections and there is an increase in rulings on these issues in various states, we will likely see an increase in petitions filed around the country as claimants avail themselves of legal protections as case precedents.

Top Claims Involved in Employment Cases Caused by COVID-19
The table and graph below depict the claims involved in the COVID Employment Cases. The table shows the number of overall COVID Employment Cases in the top row, followed by each case type in the subsequent rows. Since a case may fall into more than one case type, the numbers do not need to equal the overall COVID Employment Case numbers.
Despite the increased case filings in recent months, the 696 COVID Employment Cases still comprise only three percent of the 19,957 employment cases filed in 2020. Looking at the COVID Employment Cases, 73% involved retaliation claims (510 cases), while 45% and 41% involved discrimination claims (313 cases), and FMLA claims (283 cases), respectively.
It is logical for retaliation, discrimination, and FMLA claims to comprise the highest number of claims during the pandemic, given the common fact patterns of the cases filed. For example, when an employee contracted COVID-19 and was fired or prevented from returning to work. These cases often involved retaliation claims, as well as American Disability Act (ADA) and Family Medical Leave Act (FMLA) claims. A second common fact pattern involved employers who did not provide sufficient levels of protective equipment or did not maintain sufficiently safe practices, and the employees who brought safety complaints to their employers ended up filing retaliation claims in court. These prevalent claims are closely interrelated, as discrimination often goes hand-in-hand with retaliation, and both are often intertwined with requests for accommodation (under the ADA or FMLA).
2020 COVID Employment Case Claims by Quarter and Percentage
| Q1 | Q2 | Q3 | Q4 | Total | Percent | |
| Employment cases | 14 | 106 | 207 | 369 | 696 | 100% |
| Accommodation | 2 | 19 | 34 | 81 | 136 | 20% |
| Discrimination | 12 | 35 | 76 | 190 | 313 | 45% |
| Harassment | 6 | 13 | 18 | 63 | 100 | 14% |
| Retaliation | 9 | 74 | 158 | 269 | 510 | 73% |
| ADA | 4 | 18 | 33 | 82 | 137 | 20% |
| FLSA | 3 | 53 | 82 | 121 | 259 | 37% |
| FMLA | 2 | 44 | 100 | 137 | 283 | 41% |

Breakdown by Jurisdiction of COVID Employment Cases Filed
The Southern District of New York, the Southern District of Florida, and the District of New Jersey had the highest numbers of COVID Employment Cases filed in 2020 (60, 44, and 44 cases, respectively), followed by the Eastern District of Pennsylvania with 42 cases filed. The high numbers of COVID Employment Cases filed in the Southern District of New York and the Southern District of Florida correlate with higher numbers of confirmed COVID cases in both geographical areas.
The chart below shows filings of both general employment cases and COVID Employment Cases in the districts with the highest COVID Employment Case filings. Out of the top 10 districts for COVID Employment Cases, the districts with the highest percentage of COVID Employment Cases were the District of New Jersey (9%) and the Eastern District of Michigan (8%).
The high number of COVID Employment Cases filed in the Southern District of Florida may be partially explained by the fact that there are higher numbers of non-exempt workers (and lower numbers of salaried workers), which translates to less protections for workers and more employment cases filed in general. Many of the COVID Employment Cases filed in the Southern District of Florida involve a claim under the Fair Labor Standards Act (FLSA). A common fact pattern that emerged involved an employee at a restaurant who lost work or was not paid proper overtime after the onset of the pandemic.
Quarterly Filings of Employment Cases and COVID Employment Cases in the Districts with the Highest COVID Employment Case Filings
| Q1 | Q2 | Q3 | Q4 | Total | % | ||||||
| District | E.C | C.E.C | E.C. | C.E.C. | E.C. | C.E.C. | E.C. | C.E.C. | E.C. | C.E.C. | |
| S.D.N.Y. | 266 | 2 | 281 | 12 | 317 | 13 | 377 | 33 | 1,241 | 60 | 5% |
| S.D.Fla. | 286 | 0 | 288 | 9 | 251 | 16 | 246 | 19 | 1,071 | 44 | 4% |
| D.N.J. | 123 | 0 | 129 | 8 | 116 | 18 | 136 | 18 | 504 | 44 | 9% |
| E.D.Pa. | 199 | 1 | 196 | 9 | 161 | 10 | 303 | 22 | 859 | 42 | 5% |
| M.D.Fla. | 227 | 0 | 243 | 5 | 226 | 17 | 235 | 12 | 931 | 34 | 4% |
| E.D.N.Y. | 263 | 1 | 198 | 2 | 267 | 4 | 312 | 15 | 1,040 | 22 | 2% |
| E.D.Mich. | 74 | 1 | 77 | 3 | 50 | 9 | 80 | 9 | 281 | 22 | 8% |
| N.D.Ill. | 189 | 2 | 162 | 4 | 114 | 5 | 206 | 10 | 671 | 21 | 3% |
| S.D.Ohio | 113 | 0 | 114 | 4 | 99 | 4 | 127 | 11 | 453 | 19 | 4% |
| N.D.Ohio | 126 | 0 | 93 | 4 | 81 | 7 | 108 | 8 | 408 | 19 | 5% |
E.C. = Employment Cases
C.E.C. = COVID Employment Cases

Our team continues to monitor the impact of the COVID-19 pandemic on litigation and aims to present meaningful updates to trends as they unfold. We will monitor new case filings and explore the long term effect on civil court cases in federal and state courts.
Read more details about the impact of the pandemic on employment litigation by requesting our special report, published October 2020.
Read about new research by subscribing to our blog.
This data was gathered from the Lex Machina platform on January 29, 2021. The Lex Machina platform updates daily and therefore any numbers in this blog post will change as new cases get added to the court systems. This report is meant to provide trends and general research information as of the date of publication.