Not long after the COVID-19 pandemic began, Lex Machina analyzed its state civil trial court modules to examine how the pandemic-driven shutdown affected new case filings in state courts. Now, several months into the pandemic, Lex Machina conducted another survey of our state court data to provide an analysis of evolving trends. Since the previous analysis, Lex Machina expanded state court coverage to include New York County Supreme Court, which is incorporated in the current examination below.
Our survey of new case filings in ten state courts during June until September 2020 revealed the following observations:
- Subsequent to the drop in case filings in April 2020, case filings generally rose in all state courts until July and began to plateau, with small fluctuations, until August.
- In August-September 2020, half of the state courts saw their numbers of total case filings begin to increase, while the other half saw their case filings plateau or decrease.
- Total case filings in September 2020 still remain generally (between 8%-52%) lower than in September 2019 across seven of the ten state courts.
- Case filings for limited jurisdiction cases continue to be more negatively impacted than general jurisdiction cases in the California and Texas courts that Lex Machina covers, suggesting that corporate litigation plaintiffs continue to be less affected in pursuing litigation than individuals.
Methodology
Lex Machina tracks state court filings in ten state courts and provides analytics used to make data-driven decisions in the business and practice of law. Each state court has its own docketing system and Lex Machina obtains dockets and documents through the various systems. In each of the ten state courts that we cover, Lex Machina has the case information for all civil cases filed as of January 1st, 2016 through present. We do not have information about criminal, family, or small claims cases.
The court-specific case classifications that Lex Machina uses (e.g., the Case Type “Commercial Division” for New York County Supreme Court or the Field of Law “Corporation Law” for Delaware Court of Chancery) are derived from data that the respective court provides. The court-specific case tags that Lex Machina uses are also based on that court’s classification (e.g., the Case Tags “General Jurisdiction” and “Limited Jurisdiction” for each of Los Angeles County Superior Court, Sacramento County Superior Court, and San Bernardino County Superior Court).
Surveying Total New Case Filings in State Courts by Month
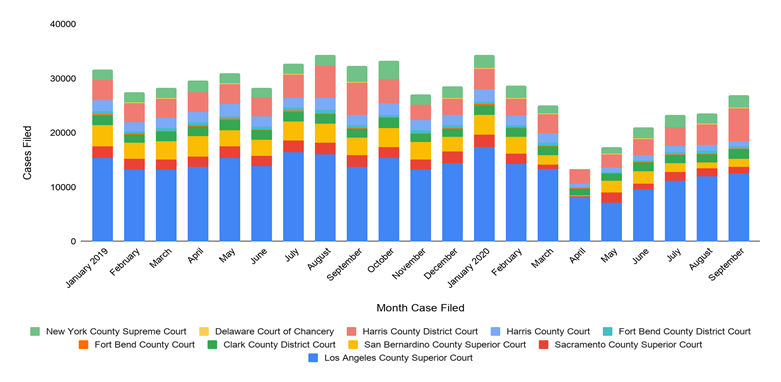
The chart below shows the number of new case filings per month from January 2019 through September 2020 for each of the ten state court modules that Lex Machina covers. The pandemic shutdown resulted in a reduced number of total new civil trial cases across the ten state courts in April, but case filings steadily increased through September, with a slight plateau between July and August. However, total case filings are still down compared to previous years. There was a 35% decrease in total case filings in August 2020 compared to August 2019 and a 17% decrease in September 2020 compared to September 2019.
All ten state courts saw a decrease in August 2020 filings compared to 2019 (with a range of 6% to 73% less cases). Seven out of ten state courts experienced a decrease in September 2020 filings compared to 2019 (with a range of under 8% to 52% less cases).
Three state courts—the Delaware Court of Chancery, Clark County District Court, and Harris County District Court—saw an increase in case filings in 2020 compared to 2019 for September (8%, 9%, and 3% more cases, respectively).
Total New Case Filings Across Ten State Courts by Month
Year-Over-Year Comparison of New Case Filings for Ten State Courts
| Aug 2018 | Aug 2019 | % Change | Aug 2020 | % Change | Sept 2018 | Sept 2019 | % Change | Sept 2020 | % Change | |
| Delaware Court of Chancery | 77 | 101 | 31% | 96 | -6% | 59 | 93 | 58% | 100 | 8% |
| Harris County District Court | 4,691 | 5,886 | 25% | 3,811 | -44% | 6,884 | 5,914 | -14% | 6,071 | 3% |
| Harris County Court | 2,102 | 2,146 | 2% | 1,100 | -50% | 1,714 | 1,877 | 10% | 956 | -49% |
| Fort Bend County District Court | 543 | 623 | 15% | 478 | -27% | 480 | 529 | 10% | 403 | -24% |
| Fort Bend County Court | 324 | 244 | -25% | 158 | -27% | 176 | 233 | 32% | 124 | -47% |
| Clark County District Court | 1,668 | 1,696 | 2% | 1,502 | -12% | 1,488 | 1,577 | 6% | 1,723 | 9% |
| San Bernardino County Superior Court | 3,342 | 3,552 | 6% | 1,097 | -73% | 2,623 | 3,265 | 24% | 1,556 | -52% |
| Sacramento County Superior Court | 2,166 | 2,062 | -5% | 1,440 | -29% | 1,723 | 2,139 | 24% | 1,156 | -46% |
| Los Angeles County Superior Court | 13,999 | 16,080 | 15% | 11,986 | -29% | 12,469 | 13,717 | 10% | 12,555 | -8% |
| New York County Supreme Court | 1,938 | 2,026 | 5% | 1,914 | -6% | 2,351 | 3,047 | 30% | 2,354 | -23% |
| All States Combined | 30,850 | 34,416 | 12% | 23,582 | -35% | 29,967 | 32,391 | 8% | 26,998 | -17% |
Surveying New Case Filings – New York County (Manhattan)
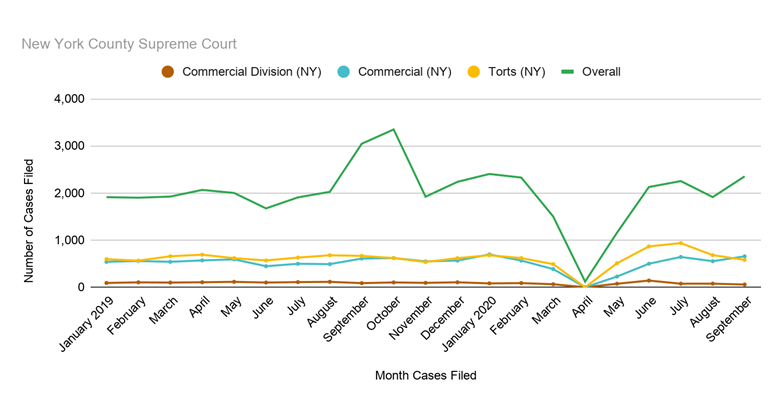
Lex Machina’s newest court, the New York County Supreme Court (the “Manhattan Court”), was shut down to all non-essential functions from March 22, 2020 until May 25th, when the state’s e-filing system reopened. E-filings of certain cases (such as evictions or foreclosures due to COVID-19) remained barred until June 20, 2020. After the Manhattan Court saw new case filings plummet in April 2020, the subsequent number of cases filed rose steadily until June 2020. From June to September of 2020, case filings plateaued with small fluctuations. The number of cases filed in Manhattan Court in August 2020 were 6% less than the cases filed in August 2019, while the number of cases filed in September 2020 were 23% less than the cases filed in September 2019.
New Case Filings by Month – New York County (Manhattan)
Year-Over-Year Comparison of New Case Filings – New York County (Manhattan)
New York County Supreme Court
| Aug 2018 | Aug 2019 | % Change | Aug 2020 | % Change | Sept 2018 | Sept 2019 | % Change | Sept 2020 | % Change | |
| Commercial Division (NY) | 93 | 115 | 24% | 76 | -42% | 76 | 87 | 14% | 58 | -33% |
| Commercial (NY) | 469 | 491 | 5% | 553 | 13% | 440 | 609 | 38% | 656 | 8% |
| Torts (NY) | 612 | 679 | 11% | 682 | 0% | 504 | 666 | 32% | 581 | -13% |
| Overall | 1,938 | 2,026 | 5% | 1,914 | -6% | 2,351 | 3,047 | 30% | 2,354 | -23% |
Surveying New Case Filings – Los Angeles
In California superior courts, civil trial cases may be filed as either general or limited jurisdiction. General Jurisdiction cases may have an unlimited amount in dispute, whereas Limited Jurisdiction cases may have an amount in dispute that is no more than $25,000.
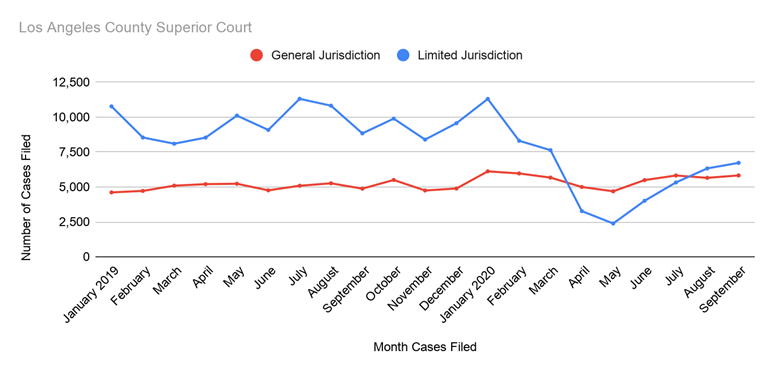
In Los Angeles County Superior Court (the “Los Angeles Court”), General Jurisdiction case filings rose steadily from May to September of 2020. A year-over-year comparison shows that in August 2020, there were more General Jurisdiction cases filed in Los Angeles Court than in the previous year (7% more cases compared to August 2019). This trend continued into September 2020, when 19% more General Jurisdiction cases were filed in Los Angeles Court compared to September 2019. One of the case types that may be contributing to stronger recent numbers of General Jurisdiction case filings is contracts cases, which steadily increased from 2,769 cases filed in May 2020 to 7,420 cases filed in September 2020. A possible driving factor behind the robust General Jurisdiction case filling numbers could be a return to “business as usual”, resulting in a surge of postponed filings that would ordinarily have been filed during summer but were delayed due to the court shutdowns.
In contrast, this court has continued to see Limited Jurisdiction case filings that remain significantly lower than the previous year. In August 2020, there were 56% less Limited Jurisdiction cases filed in Los Angeles Court than in August 2019. In September 2020, there were 24% less Limited Jurisdiction cases filed than in September 2019. Similar to early in the pandemic, the driving force behind the continued lower Limited Jurisdiction case filings is still due to lower numbers of collections cases. For example, in August 2019, 10,266 collections cases were filed compared to only 5,514 filed in August 2020.
The higher year-over-year levels of General Jurisdiction case filings may also have been affected by the existence of mandatory e-filing in Los Angeles Court, in which parties filing cases with higher disputed amounts were able to avail themselves of e-filing advantages. This effect is reflected in the data, which show that while General Jurisdiction case filings in Los Angeles Court increased compared to the previous year, General Jurisdiction case filings have remained lower in courts without e-filing or with limited e-filing options (such as San Bernardino or Sacramento County Superior Courts).
New Case Filings by Month – Los Angeles
Year-Over-Year Comparison of New Case Filings – Los Angeles
Los Angeles County Superior Court
| Aug 2018 | Aug 2019 | % Change | Aug 2020 | % Change | Sept 2018 | Sept 2019 | % Change | Sept 2020 | % Change | |
| General Jurisdiction | 5,953 | 5,265 | -12% | 5,656 | 7% | 4,634 | 4,883 | 5% | 5,828 | 19% |
| Limited Jurisdiction | 8,046 | 10,815 | 34% | 6,330 | -56% | 7,835 | 8,834 | 13% | 6,727 | -24% |
Surveying New Case Filings – Sacramento
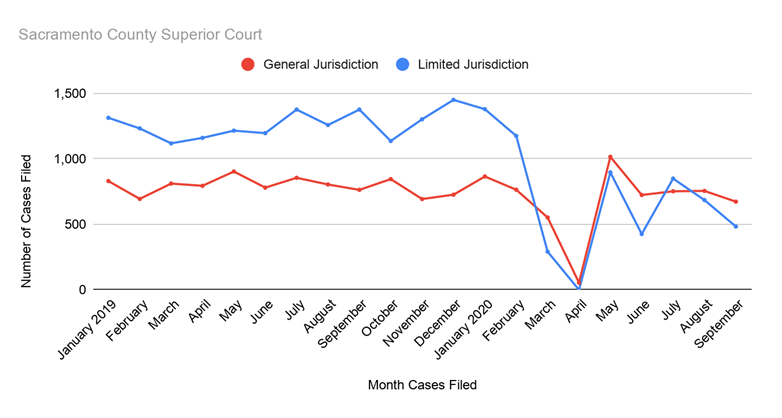
Sacramento County Superior Court (the “Sacramento Court”) was closed for non-essential new case filings from March 19 – May 5, 2020. There was an initial plummet in case filings (both General and Limited Jurisdiction) when the court was closed, followed by a surge of cases (largely General Jurisdiction along with a muted return of Limited Jurisdiction) after the court reopened. Subsequently, case filings in Sacramento Court once again began to decline (though they have not reached the bottom numbers from when the court was closed). In August 2020, there were 6% less General Jurisdiction and 44% less Limited Jurisdiction cases filed in Sacramento Court than in August 2019. The case filing numbers dropped further in September 2020, when there were 12% less General Jurisdiction and 65% less Limited Jurisdiction cases filed than in September 2019. Similar to Los Angeles Court, one of the primary driving forces behind the Sacramento Court’s decline in case filings is the drop in collections cases filed (1,141 cases filed in August 2019 compared to 582 cases filed in August 2020). The lower numbers of case filings is likely also exacerbated by the limited e-filing options available in Sacramento Court.
New Case Filings by Month – Sacramento
Year-Over-Year Comparison of New Case Filings – Sacramento
Sacramento County Superior Court
| Aug 2018 | Aug 2019 | % Change | Aug 2020 | % Change | Sept 2018 | Sept 2019 | % Change | Sept 2020 | % Change | |
| General Jurisdiction | 854 | 804 | -6% | 755 | -6% | 691 | 763 | 10% | 673 | -12% |
| Limited Jurisdiction | 1,312 | 1,258 | -4% | 685 | -44% | 1,032 | 1,376 | 33% | 483 | -65% |
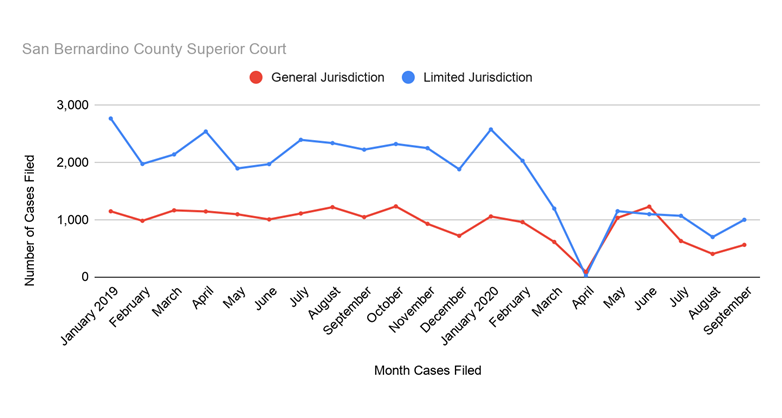
Surveying New Case Filings – San Bernardino
San Bernardino County Superior Court (the “San Bernardino Court”) was closed for non-essential new case filings from March 19 – May 28, 2020. San Bernardino Court case filings followed a similar trend as the case filings in Sacramento Court. Case filings initially plummeted (for both General and Limited Jurisdiction) when the court was closed, followed by a surge of cases after the court reopened. Subsequently, case filings in San Bernardino Court began to decline before rebounding in August-September. The number of cases (both General and Limited Jurisdiction) that were filed in San Bernardino Court in August and September of 2020 is significantly below the number of cases filed over the same time period the previous year. In August 2020, there were 72% less General Jurisdiction and 74% less Limited Jurisdiction cases filed compared to August 2019. In September 2020, there were 46% less General Jurisdiction and 55% less Limited Jurisdiction cases filed compared to September 2019. Once again, collections cases are the driving force behind the drop in case filings, with 2,118 collections cases filed in San Bernardino Court in August 2019 compared to 647 collections cases filed in August 2020. In addition, the decrease in case filings is likely exacerbated by the limited e-filing options available in San Bernardino Court (e-filing is only available at one out of six court locations that handle civil matters).
New Case Filings by Month – San Bernardino
Year-Over-Year Comparison of New Case Filings – San Bernardino
San Bernardino County Superior Court
| Aug 2018 | Aug 2019 | % Change | Aug 2020 | % Change | Sept 2018 | Sept 2019 | % Change | Sept 2020 | % Change | |
| General Jurisdiction | 1,127 | 1,217 | 8% | 401 | -72% | 920 | 1,044 | 13% | 559 | -46% |
| Limited Jurisdiction | 2,215 | 2,335 | 5% | 696 | -74% | 1,703 | 2,221 | 30% | 997 | -55% |
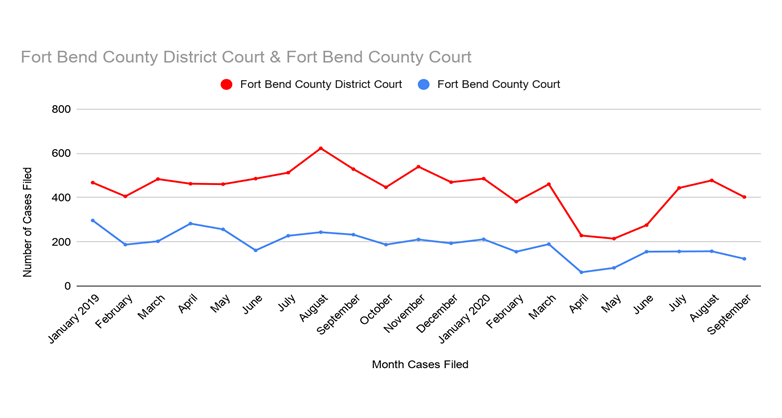
Surveying New Case Filings – Houston Metro Area
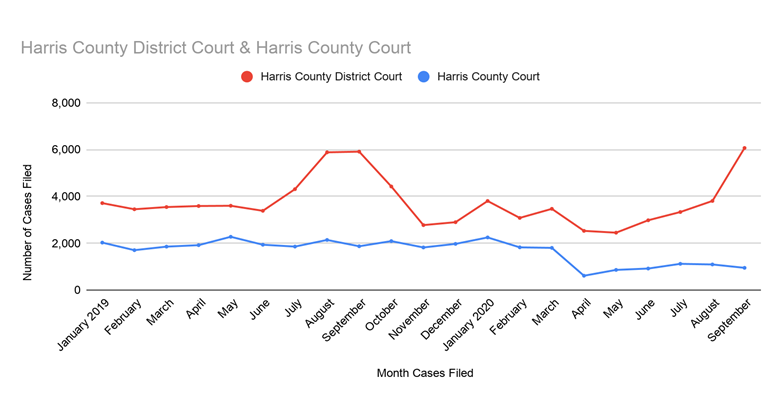
In Texas, civil trial cases may be heard in district or county court, with differences in the matters covered and whether the amount in controversy is unlimited (District Court) or limited (County Court). For the county courts in both Fort Bend and Harris, the case filings in 2020 declined in April-May, followed by a slight rise and then a plateau. Fort Bend County District Court (the “Fort Bend District Court”) experienced a similar trend in 2020, though with a more exaggerated plunge in April-May, followed by a more steep recovery in June-July. Furthermore, the number of cases filed in Fort Bend District Court began to decline during August-September of 2020. Case filings in Harris County District Court (the “Harris District Court”) followed yet a different pattern: the slight dip in April-May was followed by a steady rise in June-August. In August-September of 2020, the number of cases filed in Harris District Court exhibited a steep climb.
The number of cases filed in both courts in Fort Bend were lower in August 2020 than in August 2019 (27% lower for each court). The year-over-year decline remained steady into September 2020 for Fort Bend District Court (24% less cases than in September 2019), but the number of cases filed in Fort Bend County Court dropped to significantly lower levels (47% less cases) in September 2020 compared to September 2019.
Harris County Court experienced a steady lowered rate of case filings in August and September of 2020 – 50% and 49% less cases filed, respectively, compared to the same months in 2019. In contrast, though Harris District Court saw a similar lowered rate of case filings in August 2020 (44% less cases filed than in August 2019), the number of cases subsequently filed in the court rose to the point that there was a year-over-year increase of 3% more cases in September 2020 compared to September 2019.
New Case Filings by Month – Fort Bend County
Year-Over-Year Comparison of New Case Filings – Fort Bend County
Fort Bend County District Court & Fort Bend County Court
| Aug 2018 | Aug 2019 | % Change | Aug 2020 | % Change | Sept 2018 | Sept 2019 | % Change | Sept 2020 | % Change | |
| Fort Bend County District Court | 543 | 623 | 15% | 478 | -27% | 480 | 529 | 10% | 403 | -24% |
| Fort Bend County Court | 324 | 244 | -25% | 158 | -27% | 176 | 233 | 32% | 124 | -47% |
New Case Filings by Month – Harris County
Year-Over-Year Comparison of New Case Filings – Harris County
Harris County District Court & Harris County Court
| Court | Aug 2018 | Aug 2019 | % Change | Aug 2020 | % Change | Sept 2018 | Sept 2019 | % Change | Sept 2020 | % Change |
| Harris County District Court | 4,691 | 5,886 | 25% | 3,811 | -44% | 6,884 | 5,914 | -14% | 6,071 | 3% |
| Harris County Court | 2,102 | 2,146 | 2% | 1,100 | -50% | 1,714 | 1,877 | 10% | 956 | -49% |
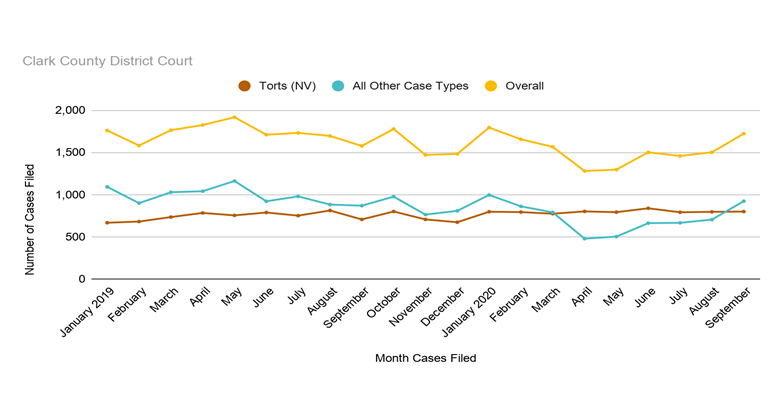
Surveying New Case Filings – Las Vegas
After the dip in case filings in April-May of 2020, the slow rise in case filings in Clark County District Court (Las Vegas) (the “Las Vegas Court”) reached a plateau during June to August. During August 2020, 12% less cases were filed in Las Vegas Court than in August 2019. However, in September 2020, Las Vegas Court saw a rise in case filings across case types that resulted in a higher year-over-year rate of cases filed than in the previous year (9% more cases filed compared to September 2019). Two notable case type categories that have seen a fairly steady incline of cases filed since May 2020 are Construction Defect & Contract cases and Real Property cases.
New Case Filings by Month – Las Vegas
Year-Over-Year Comparison of New Case Filings – Las Vegas
Clark County District Court
| Aug 2018 | Aug 2019 | % Change | Aug 2020 | % Change | Sept 2018 | Sept 2019 | % Change | Sept 2020 | % Change | |
| Torts (NV) | 697 | 813 | 17% | 797 | -2% | 602 | 707 | 17% | 800 | 13% |
| All Other Case Types | 971 | 883 | -9% | 705 | -18% | 886 | 870 | -2% | 923 | 6% |
| Overall | 1,668 | 1,696 | 2% | 1,502 | -12% | 1,488 | 1,577 | 6% | 1,723 | 9% |
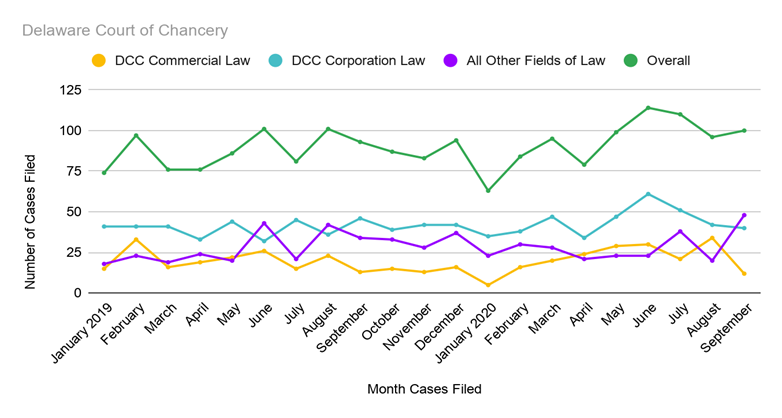
Surveying New Case Filings – Delaware Court of Chancery
The number of total cases filed in the Delaware Court of Chancery (the “DCC”) remained fairly constant, with minor fluctuations, between 50 to 125 total cases filed. Hovering around 100 cases per month since April 2020, DCC’s total number of case filings has been generally higher than the previous normal range of 75-100 per month. The bulk of cases filed in DCC were under the case types Commercial Law, Corporation Law, and All Other Fields of Law. In terms of the Nature of Claims filed in DCC since January 2020, Corporate/Commercial Civil Actions, Breach of Fiduciary Duty, Complaints to Inspect Corporate Books and Records are the most filed claims, which is consistent with prior years.
New Case Filings by Month – Delaware Court of Chancery
Year-Over-Year Comparison of New Case Filings – Delaware Court of Chancery
Delaware Court of Chancery Court
| Aug 2018 | Aug 2019 | % Change | Aug 2020 | % Change | Sept 2018 | Sept 2019 | % Change | Sept 2020 | % Change | |
| Commercial Law | 24 | 23 | -4% | 34 | 46% | 15 | 13 | -13% | 12 | -8% |
| Corporation Law | 28 | 36 | 29% | 42 | 21% | 29 | 46 | 59% | 40 | -13% |
| All Other Fields of Law | 25 | 42 | 68% | 20 | -88% | 15 | 34 | 127% | 48 | 41% |
| Overall | 77 | 101 | 31% | 96 | -6% | 59 | 93 | 58% | 100 | 8% |
Our team continues to monitor the impact of the COVID-19 pandemic on litigation and aims to present meaningful updates to trends as they unfold. We will monitor new case filings and explore the long term effect on civil trial court cases in state courts. In addition, Lex Machina’s COVID-19 Impact Analyzer is available as a public resource to access analytics on how the federal district court system has been impacted by COVID-19: (https://law.lexmachina.com/apps/demo?app=covid).
Read about new research by subscribing to our blog.
This data was gathered from the Lex Machina platform on October 14, 2020. The Lex Machina platform updates daily and therefore any numbers in this blog post will change as new cases get added to the court systems. This report is meant to provide trends and general research information as of the date of publication.