![]() Design patents, the kind at issue in the Apple-Samsung case now before the U.S. Supreme Court, are a small but important part of the patent litigation picture.
Design patents, the kind at issue in the Apple-Samsung case now before the U.S. Supreme Court, are a small but important part of the patent litigation picture.
Cases involving at least one design patent (a kind of patent that protect the appearance rather than the functionality of an invention), account for 270 new cases a year, or about 60-70 new cases a quarter (Fig. 1). These “design patent cases” * have, since 2012, accounted for about 5% of patent cases, although the percentage in 2016 is slightly higher at 6.4% (Fig.2). Interestingly, design patent litigation is not subject to the spikes and dips seen in patent litigation more generally.
* Note: design patent cases may include other non-design patents as well.
The case resolutions for design patent cases differ from those for cases with other types of patents (Fig. 3). For example, plaintiffs (claimants) seem more likely to win in design patent cases.
However, design patents cases are far more likely to include trademark claims than cases without design patents (Fig. 4). As a result, design patent cases share some similarities with trademark cases.
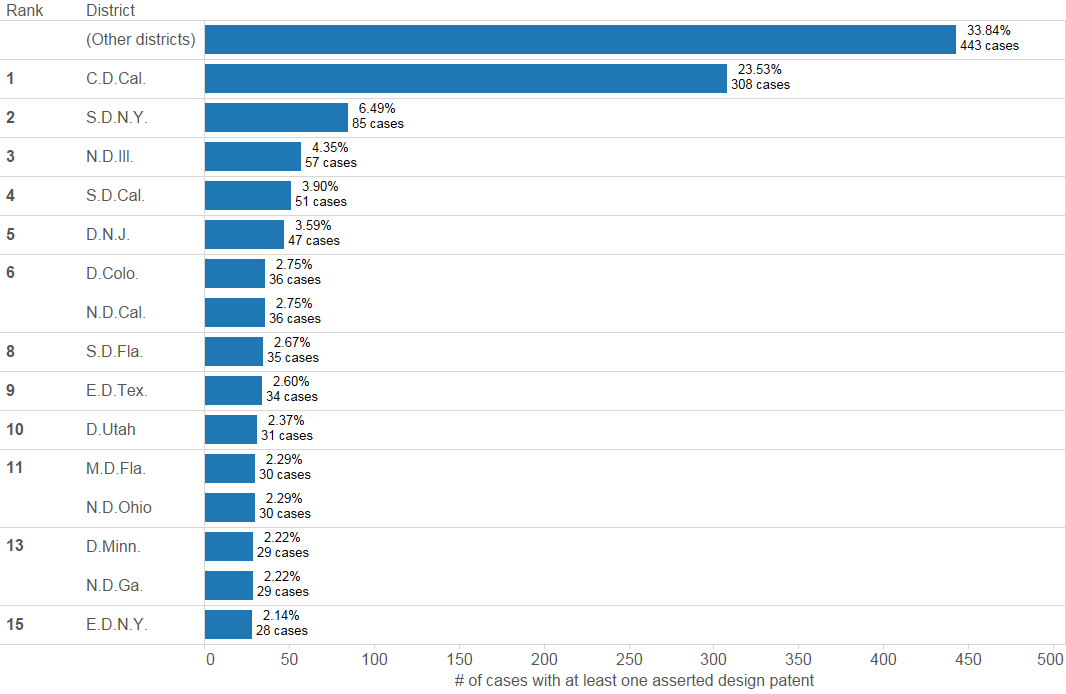
For example, the case resolutions for design patent cases grow more similar to resolutions for other patent cases after excluding resolutions based on default or consent judgments (Fig. 5). Similarly, the list of top districts for design patent cases feature the Central District of California as the leader (as it is in trademark cases) rather than the familiar Eastern District of Texas (which appears in 9th place and has had less than 3% of design patent cases since 2012).
Note: A “design patent case” case has at least one asserted design patent (but may also have other non-design patents asserted as well).
Fig. 1: Design patent vs other patent litigation by quarter, 2012-2016 Q3
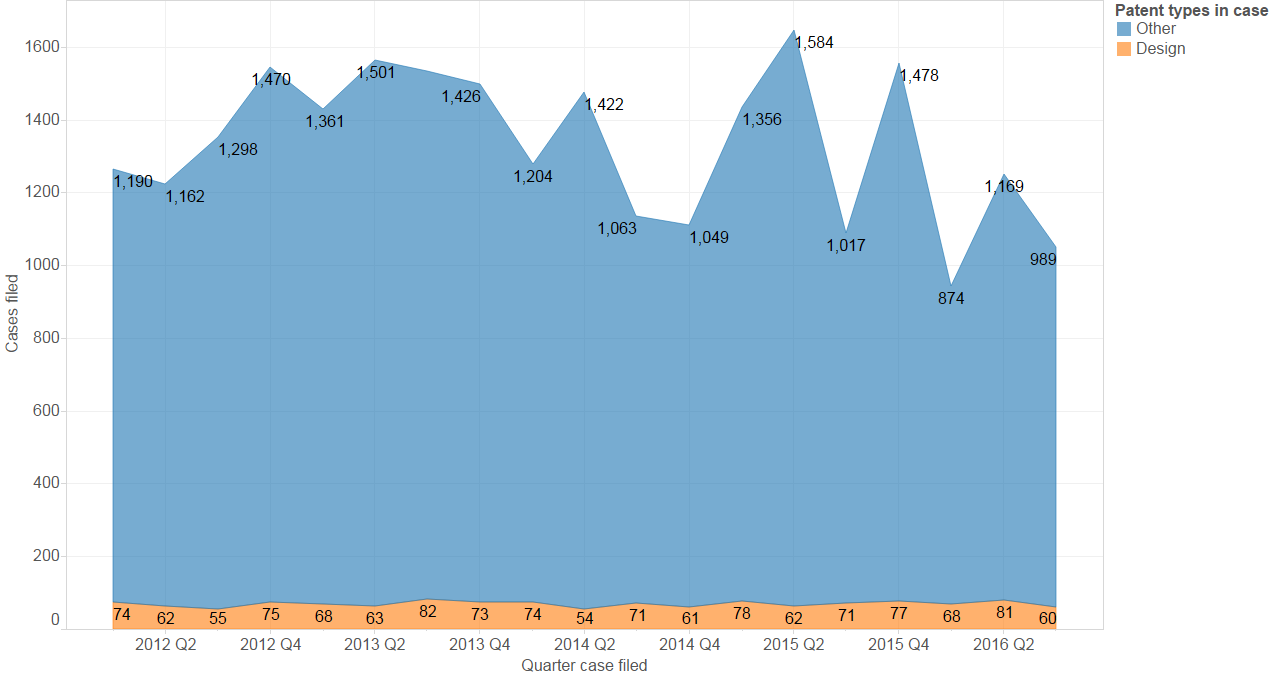
Fig. 2: Percentage of patent cases including a design patent by year, 2012-2016 Q3
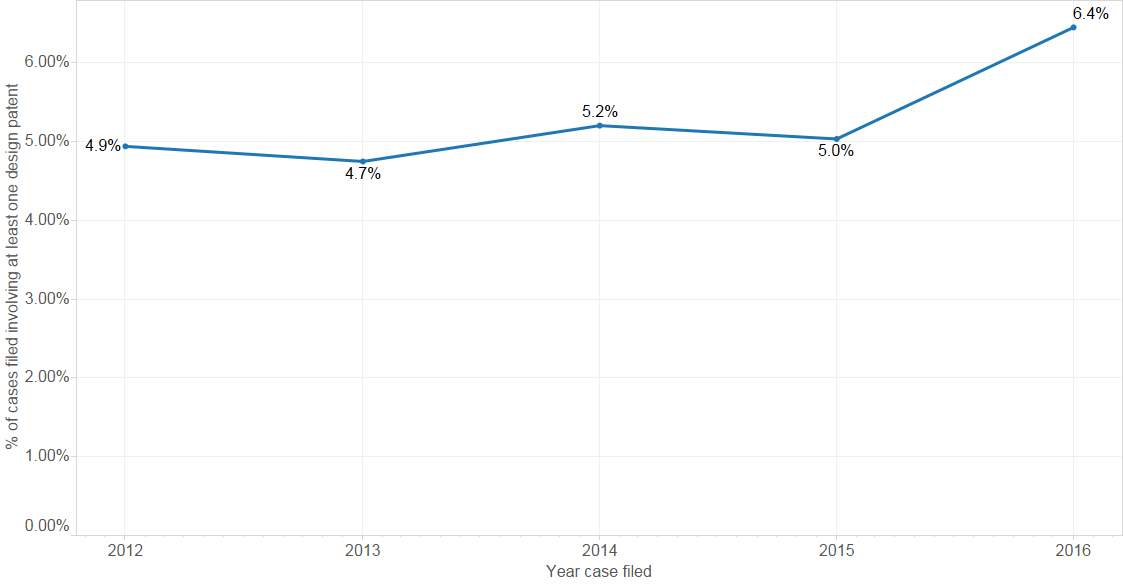
Fig. 3: Resolutions: design patent cases vs other, cases filed 2012-2016 Q3
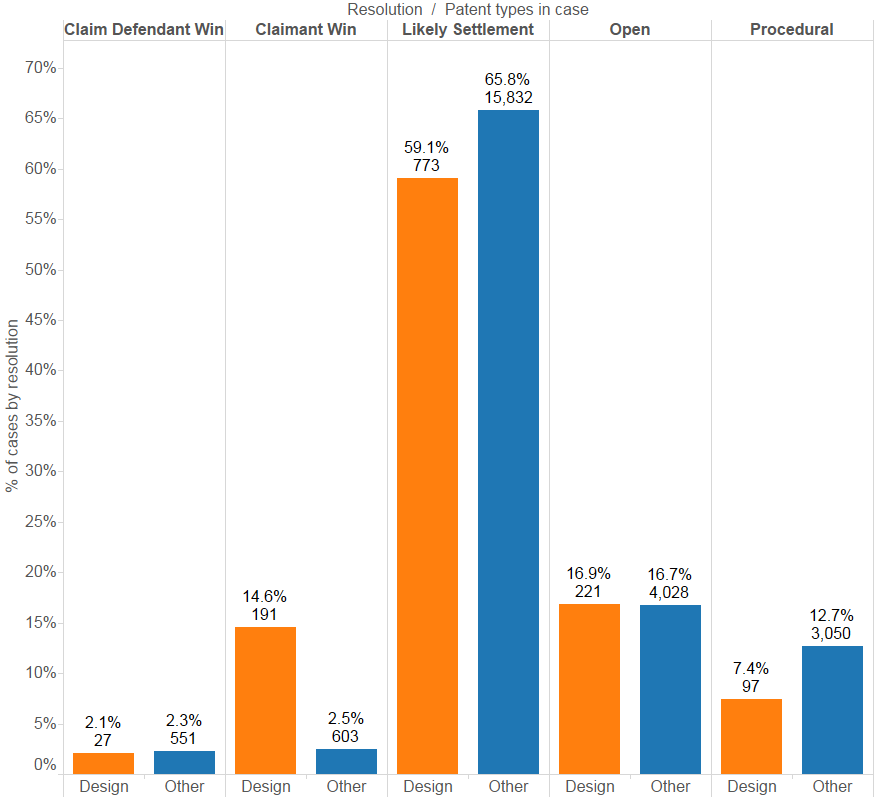
Fig. 4: Trademark and patent claim overlap by design patent cases vs other, cases filed 2012-2016 Q3
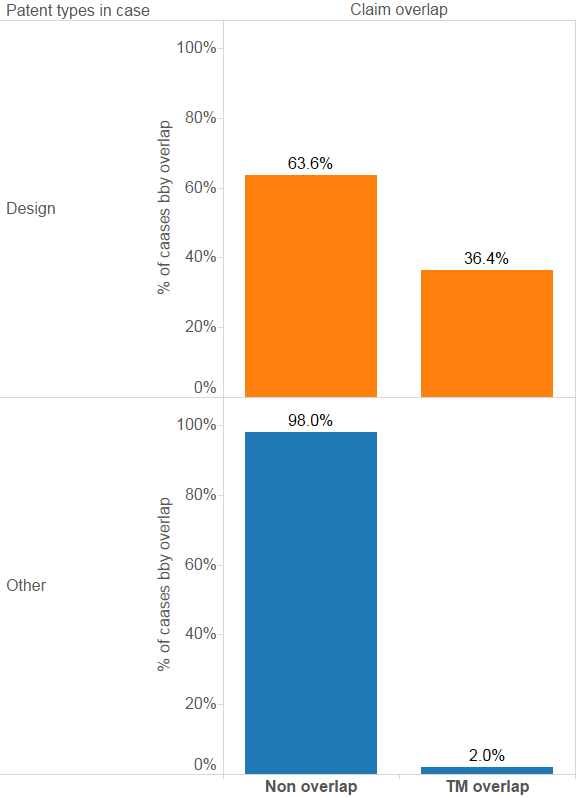
Fig. 5: Resolutions: design patent cases vs other (excluding default and consent judgments), cases filed 2012-2016 Q3
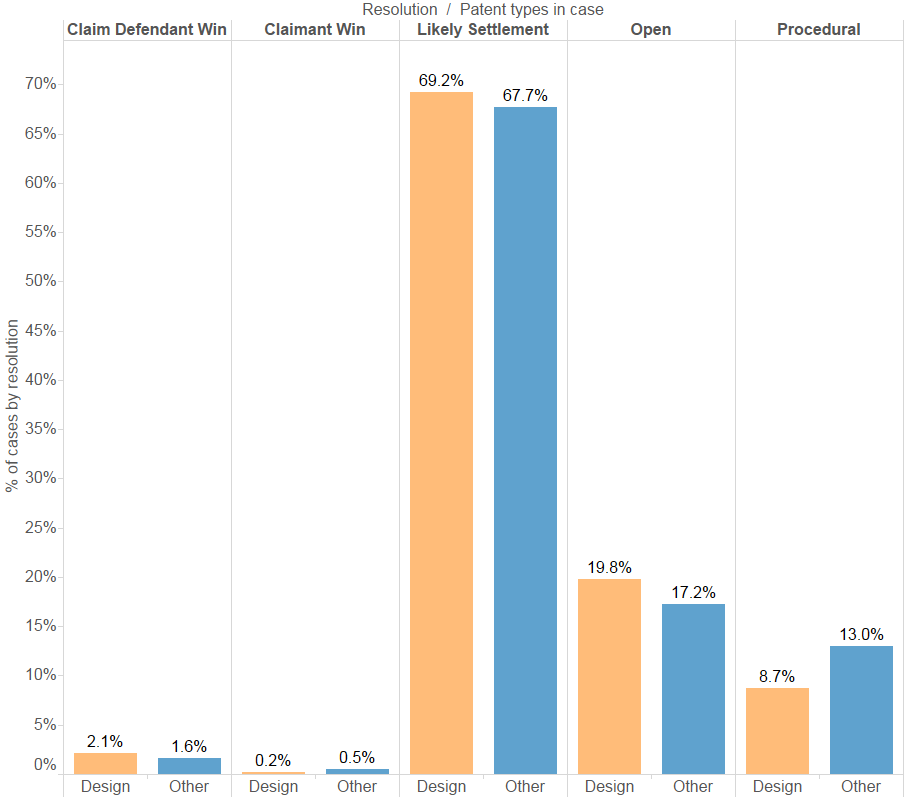
Fig. 6: Top districts by design patent cases filed 2012-2016 Q3