Patent Litigation
District Court
In the final quarter of 2017, a total of 981 patent cases were filed in U.S. District Courts, a 1.3% decrease over the previous quarter’s total of 994 cases. Cases filed in the calendar year 2017 (4,057 cases) represent a decline of 10.3% over 2016 (with 4,529 cases).
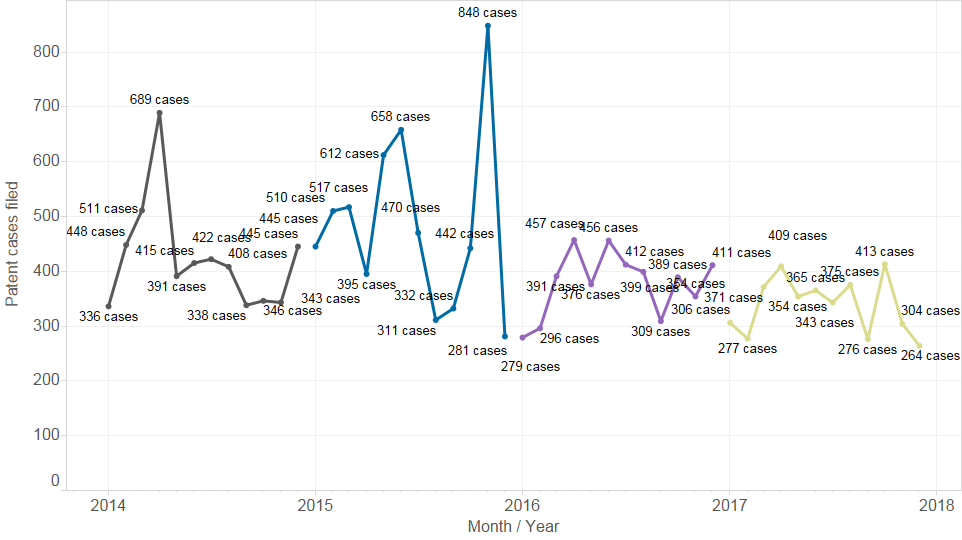
Despite the decline, Figure 2 shows that 2017 continues the pattern of relatively consistent monthly totals that has persisted since the dramatic spike in 2015 (caused by the end of Form 18).
Fig. 1: Patent cases filed, 2011 – 2017 Q4, by quarter
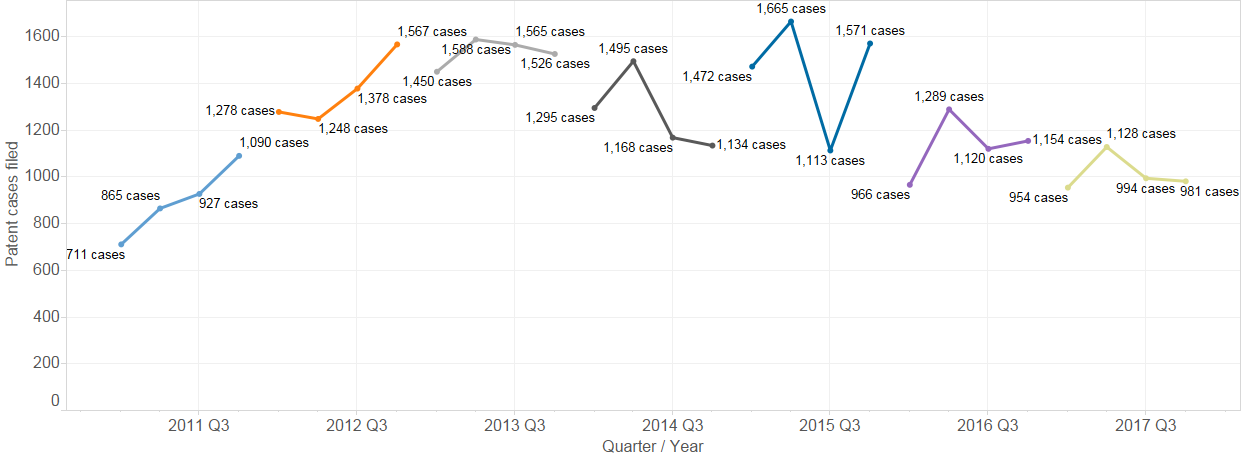
Fig. 2: Patent cases filed, 2011 – 2017 Q4, by month
Perhaps the most notable event of 2017 was the Supreme Court issuing its opinion in T.C. Heartland on May 22, holding unanimously that, under 28 U.S.C. § 1400(b) (the statute governing venue in patent suits), a domestic corporation “resides” only in its state of incorporation. Since that landmark decision, patent case filings trends have responded dramatically: the number of cases filed in the Eastern District of Texas has significantly declined and been overtaken by the number of cases filed in the District of Delaware.
Fig. 3: Top districts by patent cases filed 2014-2017 Q4
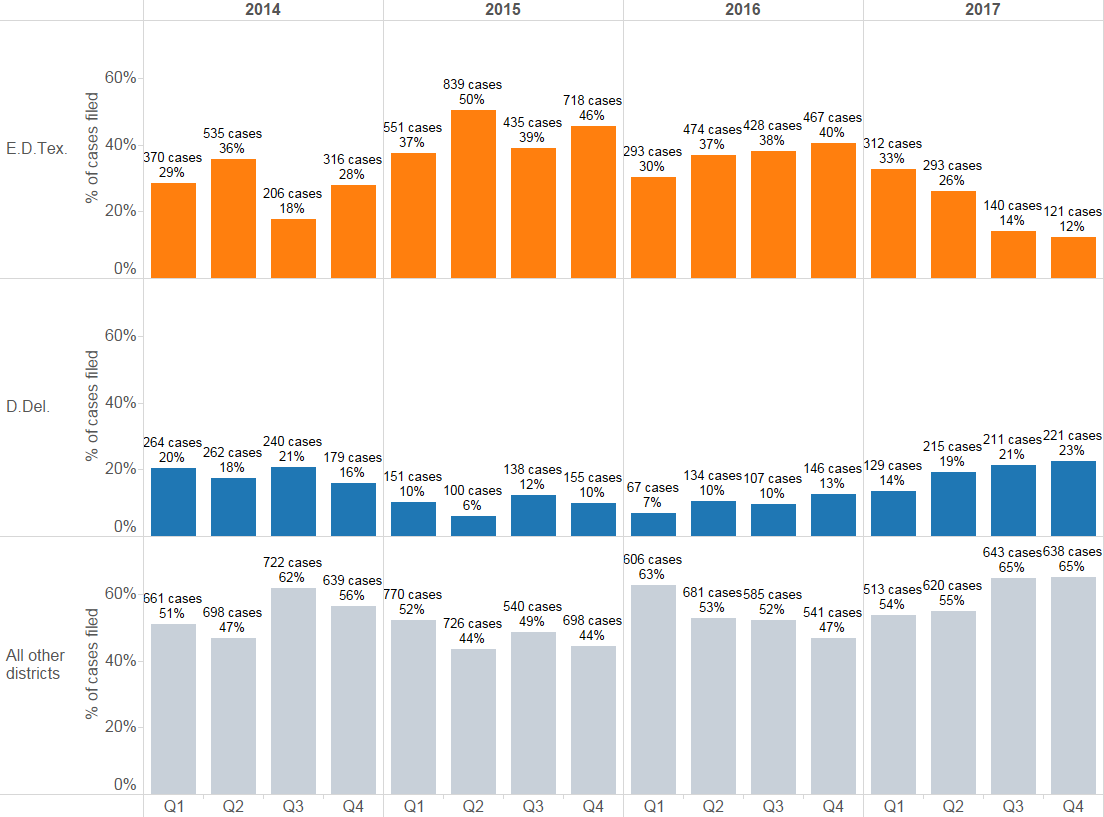
Fig. 4: Top districts by patent cases filed 2016-2017 Q3, by week
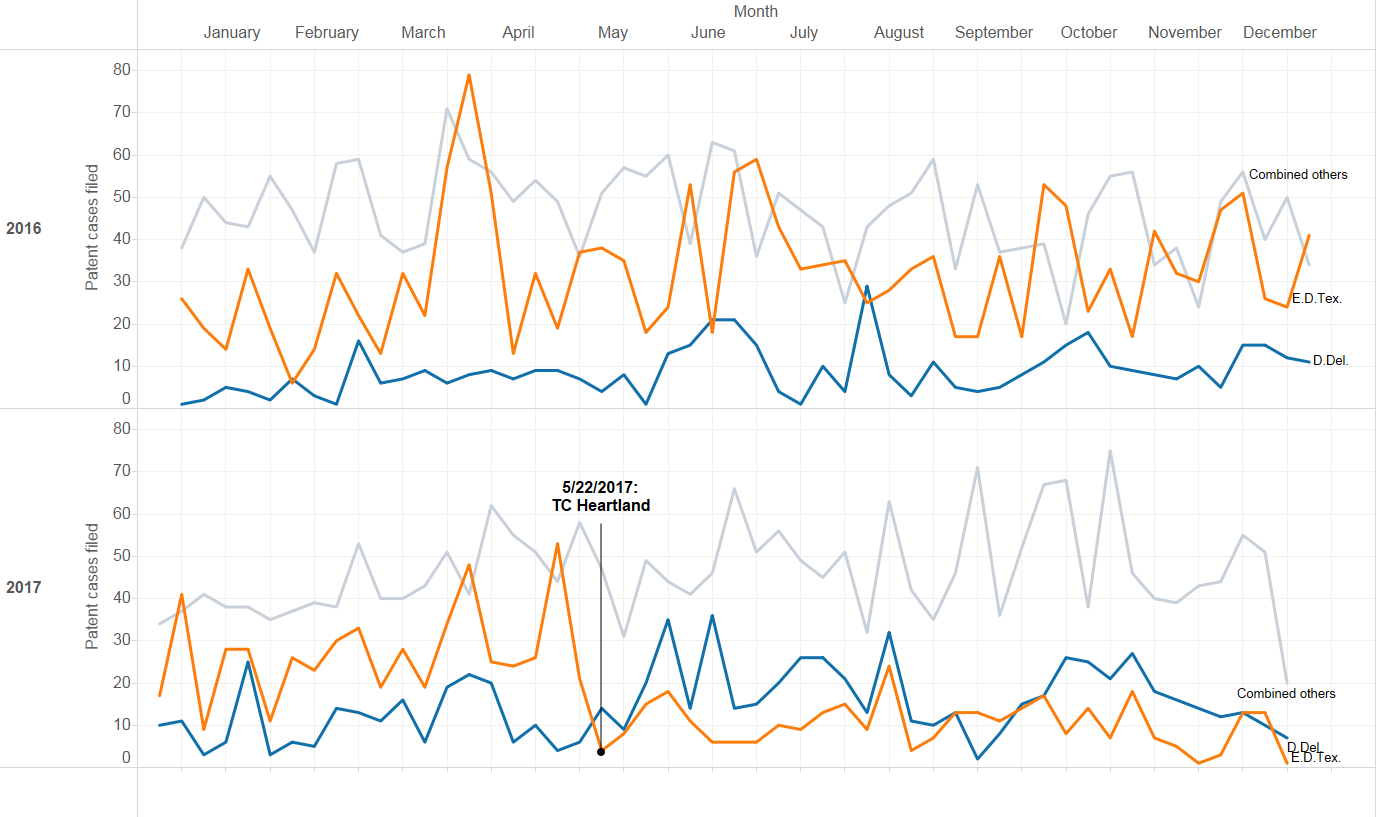
As these two charts above show, since the TC Heartland decision, the District of Delaware has seen an increasingly large share of patent litigation filed there. The Eastern District of Texas, however, has remained the second place district since the decision, and remains the top district in 2017 overall.
Fig. 5: Top districts by patent cases filed 2016-2017 Q4, pie
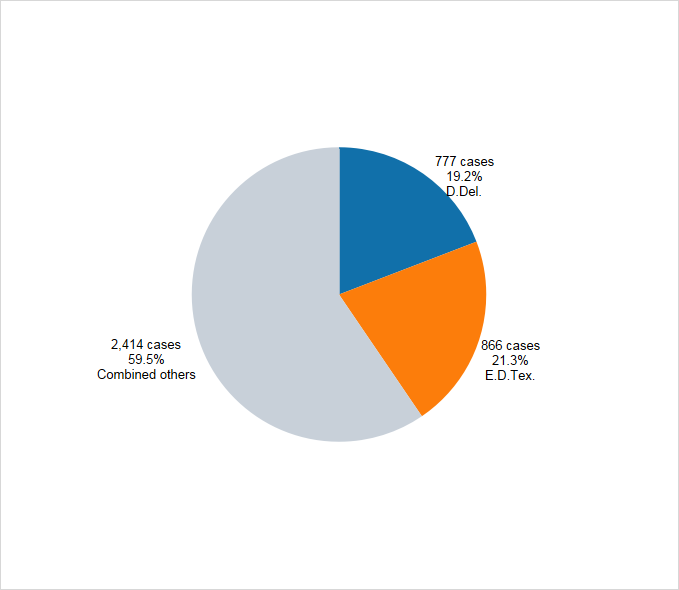
Lex Machina defines a High-Volume Plaintiff as an entity that has filed 10 or more cases within a 365 day span.
High-Volume Plaintiffs (shown in orange below) also account for most of the unpredictability and volatility in patent case filings, and have driven the move in new case filings from E.D. Texas to the District of Delaware.
Fig. 6: High volume plaintiff cases filed 2011-2017 Q3, by week
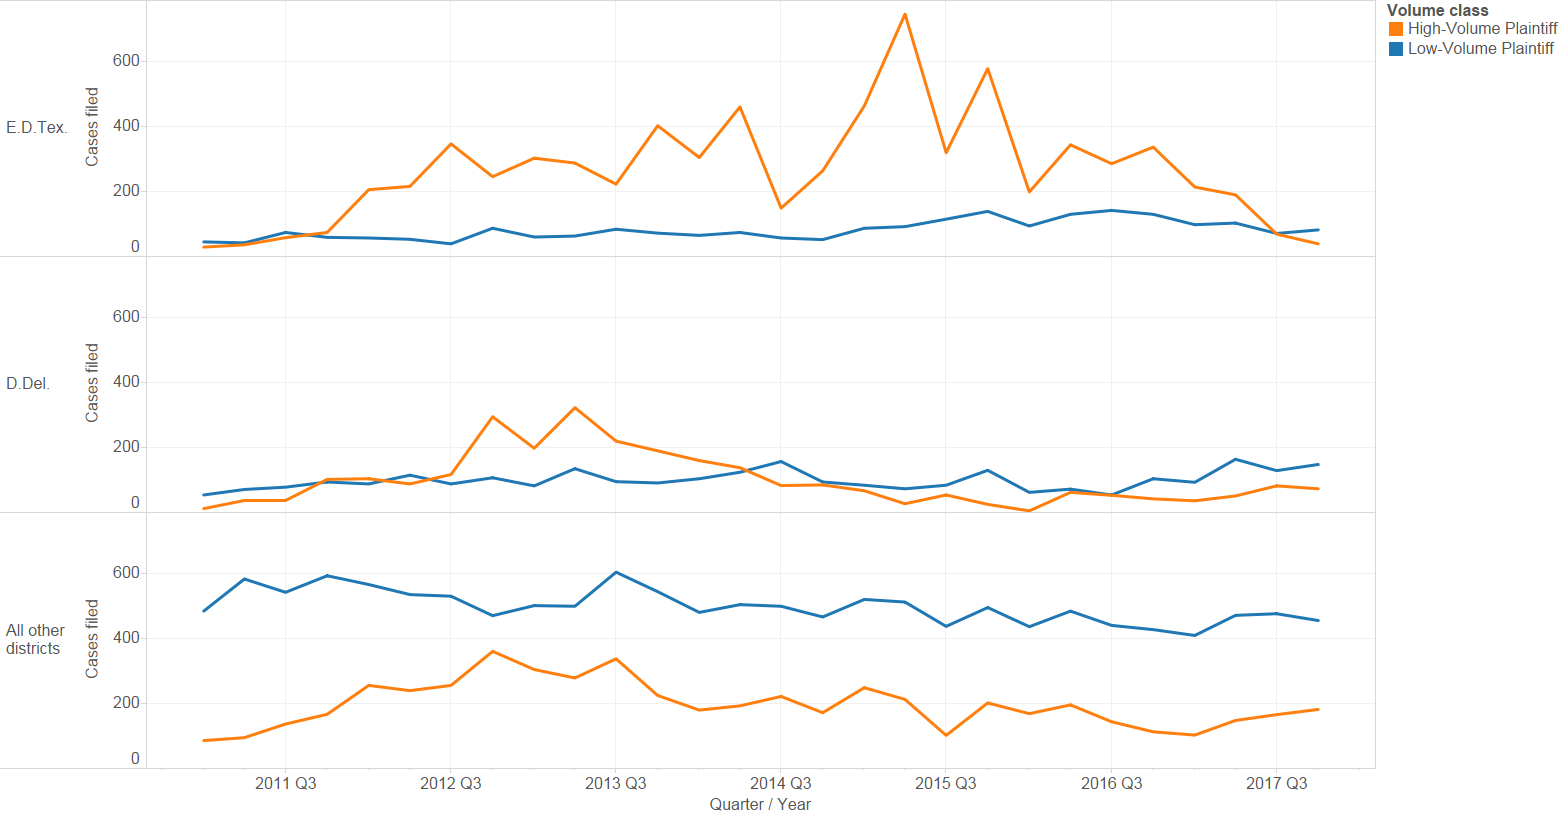
Fig. 7: Top Districts by cases filed in 2017, with percentage change from 2016
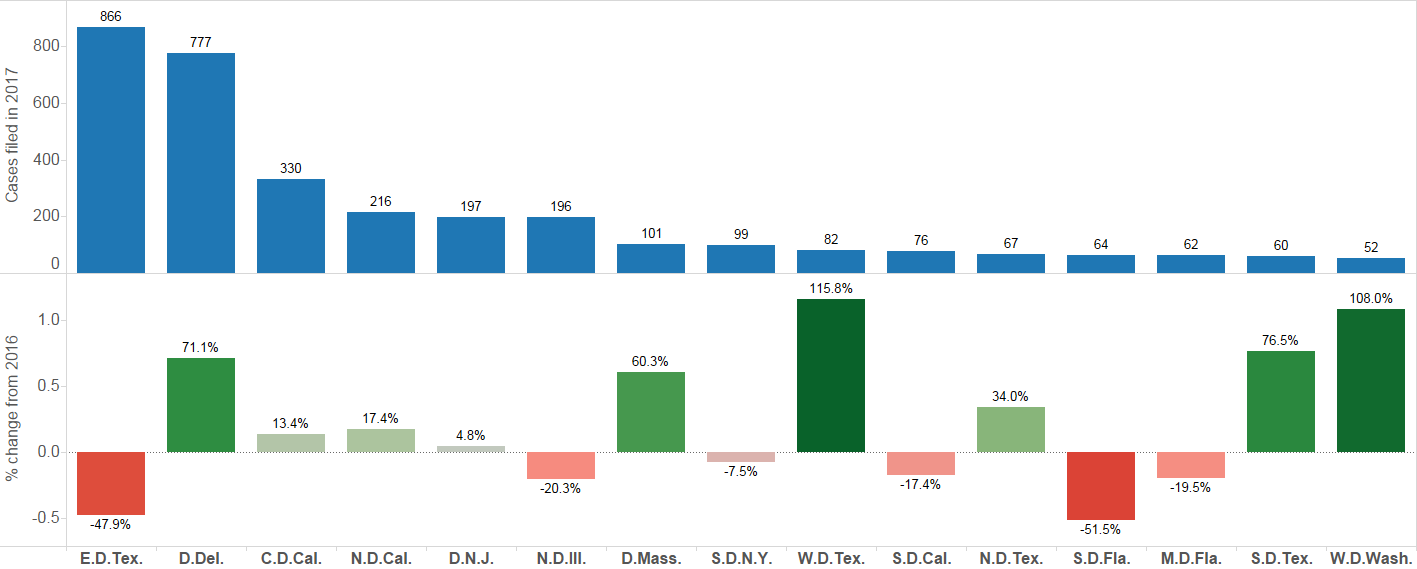
Although the District of Delaware saw the largest increases by number of cases in 2017, other districts including the District of Massachusetts, the Western and Southern Districts of Texas, and the Western District of Washington all saw significant increases in terms of percentage over 2016.
The Patent Trial and Appeal Board
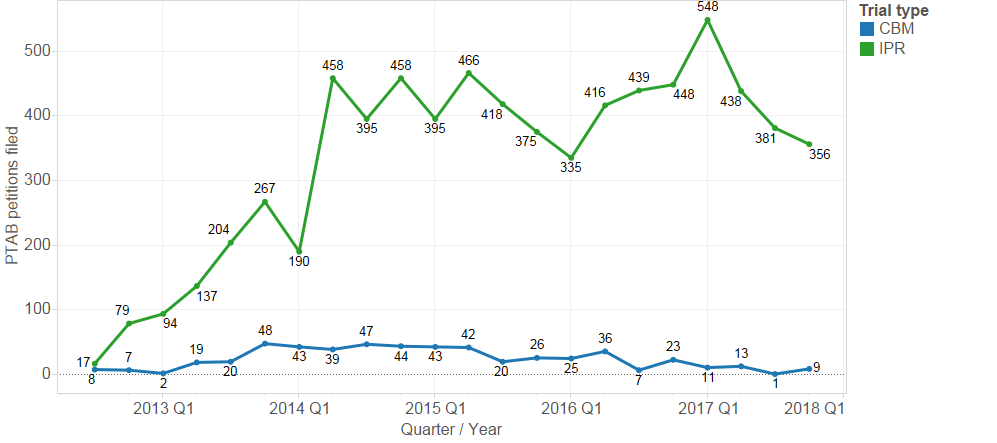
While the first quarter of 2017 saw a record high number Inter Partes Review (IPR) petitions filed at PTAB (548 petitions), each successive quarter has seen a drop in filings (438 petitions in Q2 and 381 in Q3 and 366 in Q4).
This crest/trough may be related to the Supreme Court’s granting of certiorari in Oil States Energy Servs., v. Greene’s Energy Grp. in June 2017 – a case in which petitioners argue that IPR is unconstitutional, as a non-Article III forum extinguishing a property right without a trial by jury.
There were 9 Covered Business Method (CBM) review filed, up from last quarter’s record low of only 1.
Fig. 8: CBM and IPR petitions, 2012 – 2017 Q4, by quarter
Trademark Litigation
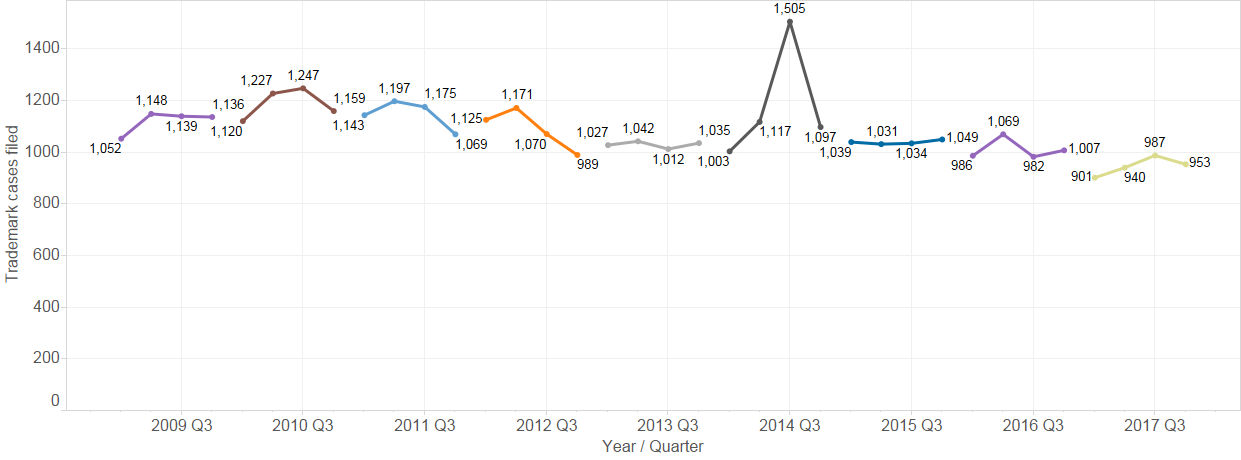
Trademark litigation filing trends have been more predictable than patent trends (or copyright). The filing of new trademark cases has declined at a slight rate over the last few years. The fourth quarter of 2017 (953 cases) represents a continuation of this trend.
For the curious, the spike in trademark case filings seen below in the third quarter of 2014 was driven by a flood of cases filed in the District of Minnesota against the National Football League, generally by former players over usage of their likeness. These cases account for about 461 of the 1,517 cases filed in Q3 2014. Without these cases, Q3 2014 appears otherwise consistent with the quarters surrounding it.
Fig. 9: Trademark cases filed, 2009 – 2017 Q4, by quarter
Copyright Litigation
Lex Machina divides copyright litigation in the U.S. district courts into two subtypes: file sharing cases (those having John Doe or anonymous defendants and accusations based on file sharing technology such as BitTorrent), and all of the other, more traditional cases. As explained in Lex Machina’s Copyright Litigation Report, these cases follow very different dynamics.
From its apogee in Q1 of 2015 at over 900 cases, the number of file sharing cases filed each quarter declined steadily and rapidly until Q2 of 2016, which saw only 262 cases. Since then, the number of cases has been less predictable – Q4 2017 (367 cases) returns to the levels seen in late 2016, after two low quarters of around 150 cases.
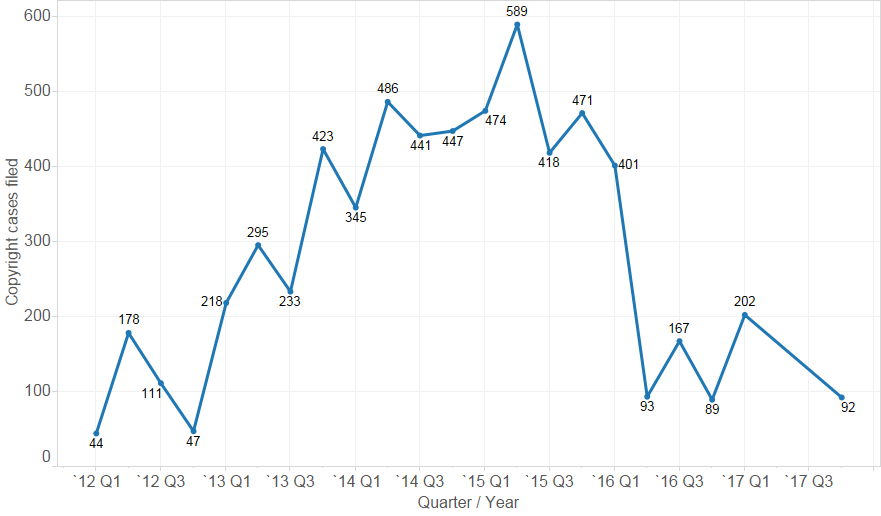
File sharing cases have been largely driven by Malibu Media (as shown in Figure 9 below). Malibu Media did not filed any cases in Q2 or Q3 2017, though they have resumed filing cases in Q4.
Fig. 10: Copyright cases filed, 2011 – 2017 Q4, by quarter
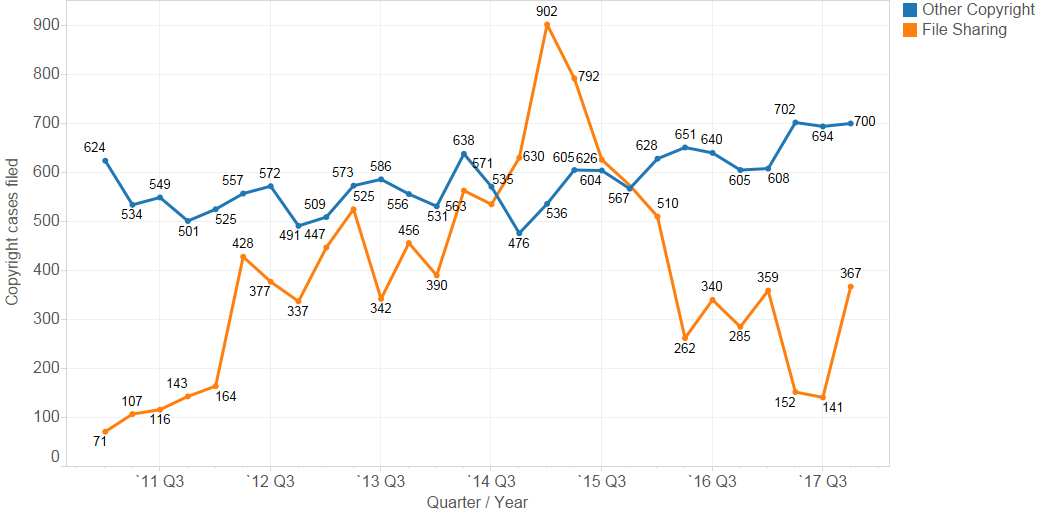
Fig. 11: Copyright cases filed by Malibu Media, 20011 – 2017 Q1, by quarter (no cases filed in Q2-Q3 2017)
Securities Litigation
Fewer cases were filed in Q4 2017 than in any of the first three quarters, but the 406 cases filed still represents nearly twice the volume of quarters from 2010-2016.
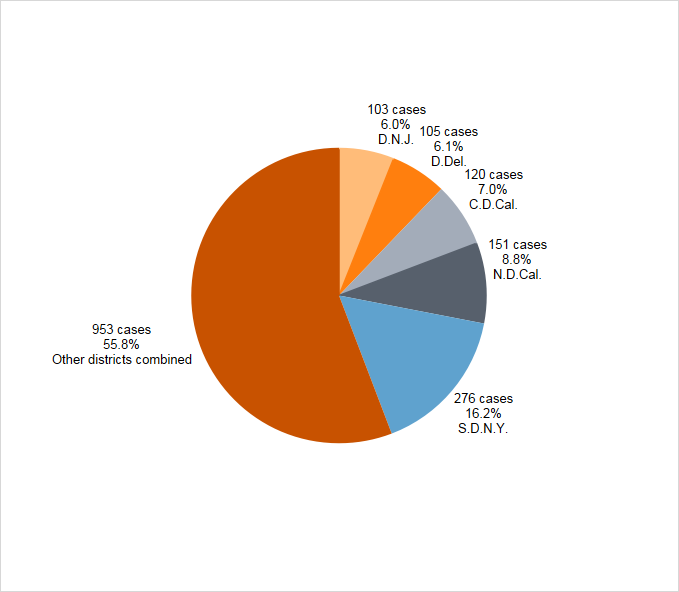
The top five districts accounted for just under half (44.2%) of the cases filed in the first half of 2017. Those districts are the Southern District of New York (16.2%), the Northern District of California (8.8%), the Central District of California (7.0%), the District of Delaware (6.1%) and the District of New Jersey (6.0%).
Fig. 12: Securities cases filed, 2011 – 2017 Q4, by quarter

Fig. 13: Top districts by securities cases filed, 2017 Q4, by quarter
Antitrust Litigation
121 cases were filed in the fourth quarter of 2017, consistent with the recent trend of 100-150 cases per quarter, but is still down from the peak, occurring from the third quarter of 2015 and into the first quarter of 2016, which saw nearly three times as many cases.
Fig. 14: Antitrust cases filed, 2011-2017 Q4, by quarter

Commercial Litigation
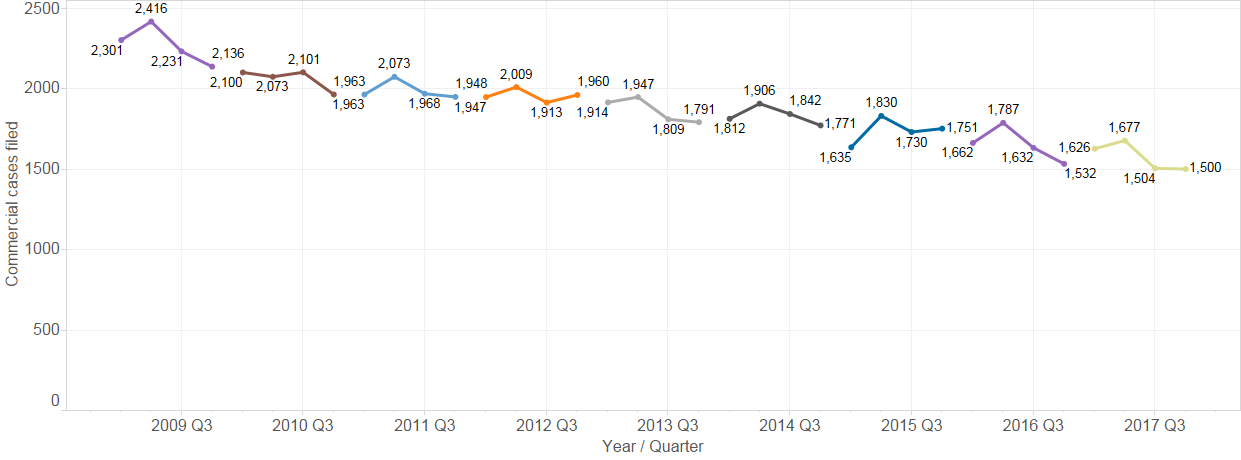
The number of Commercial cases filed each quarter has generally declined over the last several years. The 1,500 cases filed in the fourth quarter of 2017 is the lowest quarter total on record (back to 2009). Lex Machina’s Commercial cases involve claims for breach of contract or business torts between or among businesses. The decline in these cases has correlated with recovering economy in the years since 2009.
Fig. 15: Commercial cases filed, 2011-2017 Q4, by quarter
Employment Litigation
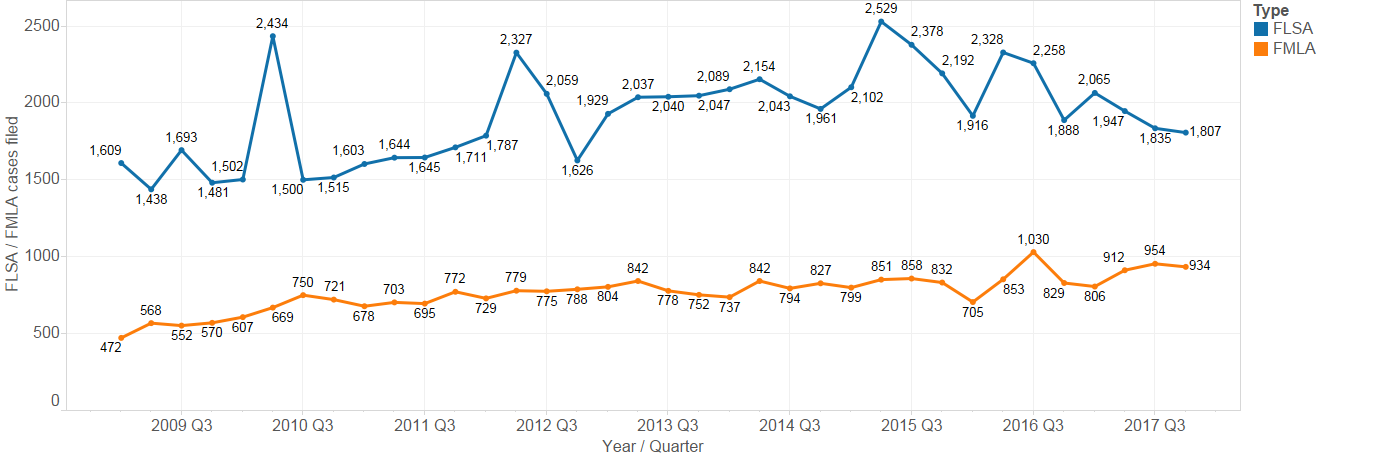
Since the last quarterly update, Lex Machina has broadened our coverage of employment litigation. In addition to cases brought under federal employment civil rights statutes alleging discrimination, harassment, and/or retaliation, we now also include wage and hour claims under the Fair Labor Standards Act (FLSA), as well as interference and retaliatory claims under the Family Medical Leave Act (FMLA).
Fig. 16: Employment cases filed, 2011-2017 Q4, by quarter
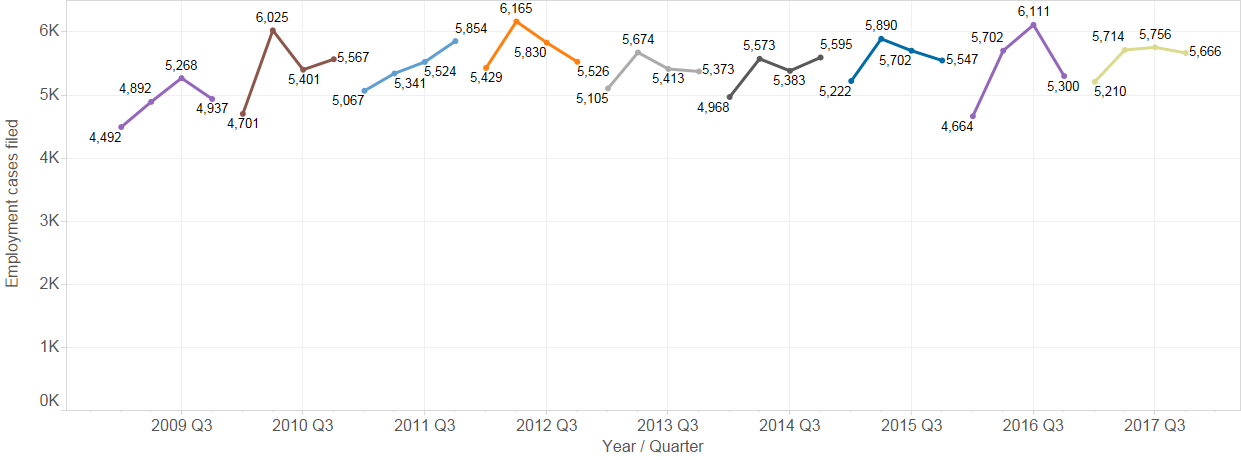
Fig. 17: FLSA, FMLA cases filed, 2011-2017 Q4, by quarter
While this information is important for lawyers and companies involved in employment litigation, it is difficult to analyze the broader policy implications. To sue in District Court, an employee must first file a claim with the Equal Employment Opportunity Commission (EEOC) and receive a favorable outcome in the form a right-to-sue letter. The employee must then find a lawyer to take the case, requiring either money to hire one, or a sufficiently promising set of facts for a contingency fee arrangement to be worth an attorney’s time. Even after the case is filed, the employee must endure without settling for years and prevail with a jury before one can conclude an injury has actually occurred.
Bankruptcy Appeals in U.S. District Court
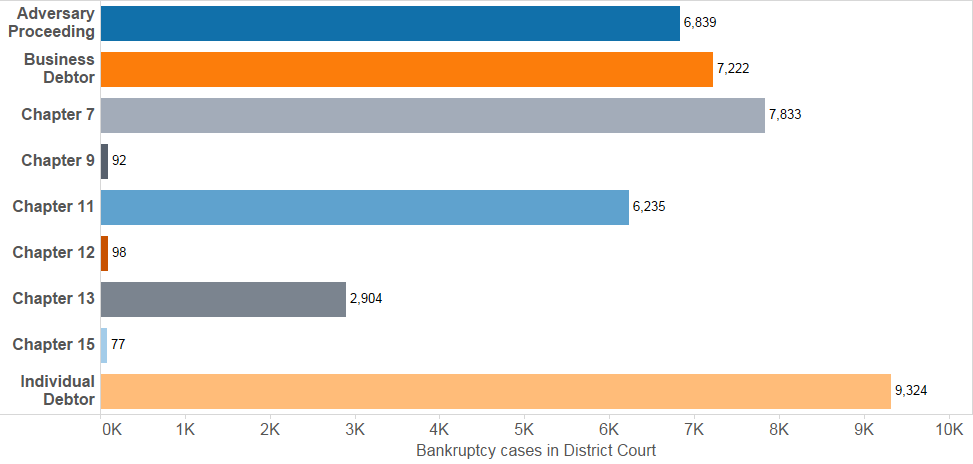
Lex Machina has analytics for Bankruptcy appeals in the district courts, including the ability to filter cases by the various chapters, by business or individual debtor, and by whether the case is an adversary proceeding.
Fig. 17: Bankruptcy appeals filed in U.S. District Courts, 2011-2017 Q4, by quarter
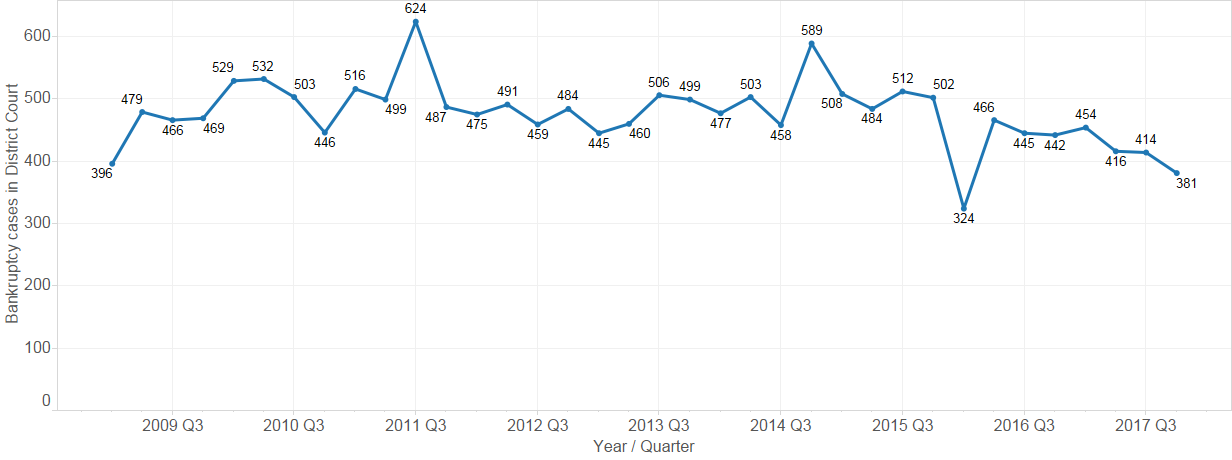
Fig. 18: Bankruptcy appeals filed in U.S. District Courts, 2011-2017 Q4, by tag
Product Liability
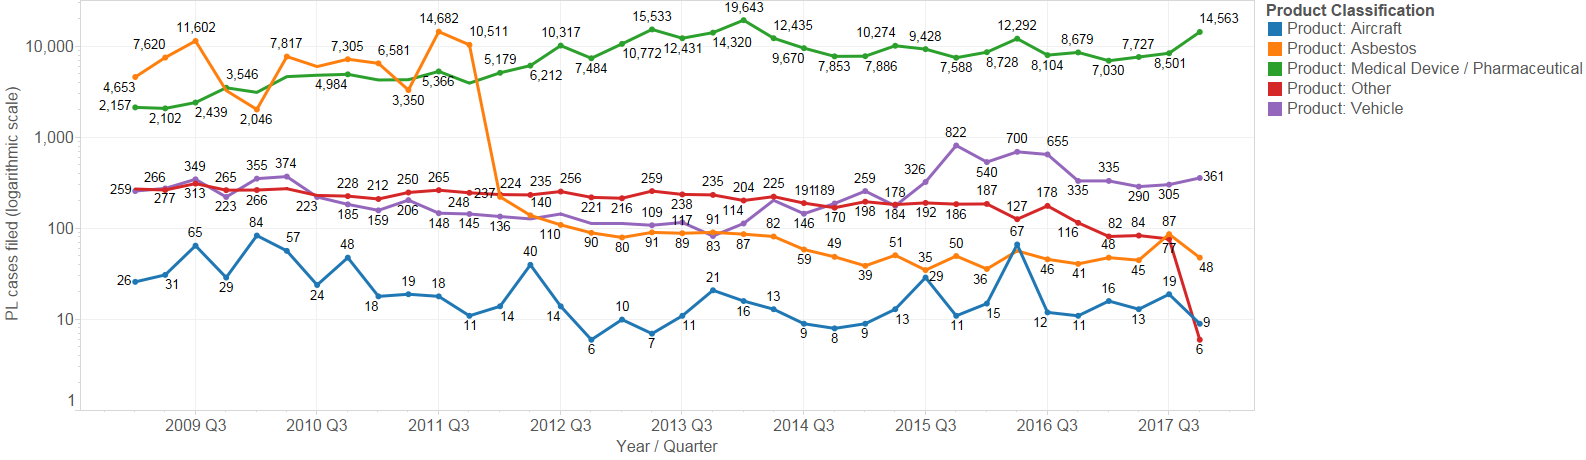
Since the last quarterly update, Lex Machina has also introduced Legal Analytics for Product Liability cases – practice area that approximately doubled the number of cases in our system. Product Liability cases are broken down by the product classification, as shown above. Because the number of cases filed per quarter from the various classifications differ so greatly, this chart uses a logarithmic scale (where the change from 1 to 10 gets as much space as from 10 to 100); otherwise the large number of medical device / pharmaceutical cases would dominate the scale.
Fig. 19: Cases filed, 2011-2017 Q4, by quarter and product classification, logarithmic scale
Conclusion
Staying up to date on the latest trends in case filing is a way to begin integrating Legal Analytics into your practice. However, the full power of Lex Machina is the ability to “twist the dials” to get data relevant to answering your questions: compare date ranges, filter by tag, party, or judgment event, or analyze how outcomes differ between districts. With tags, findings, and damages customized to each practice area, Lex Machina can give you the winning advantage.